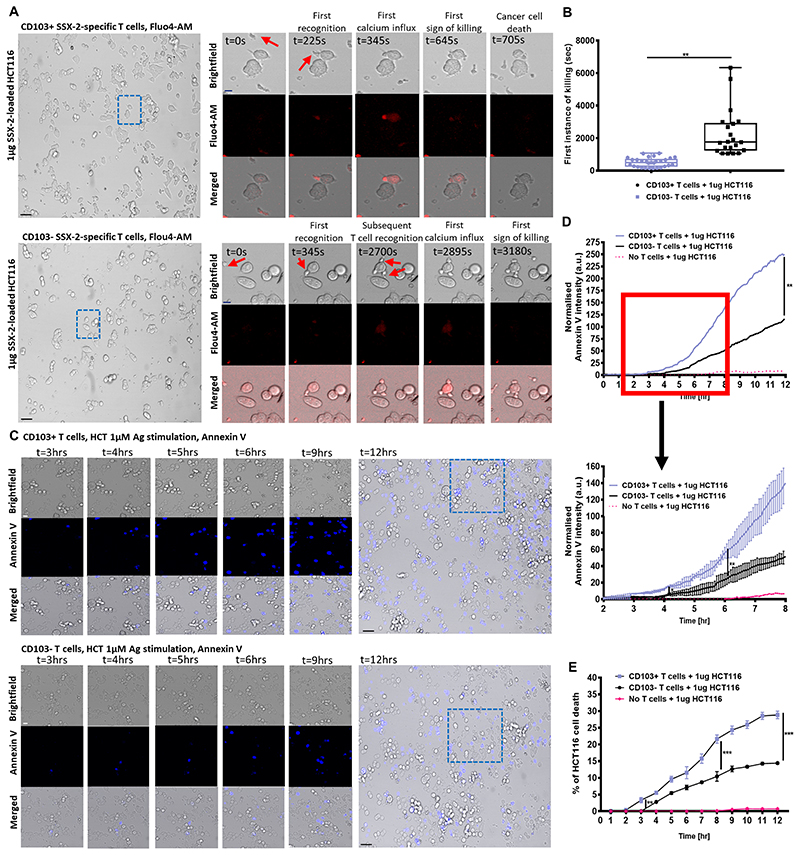
Figure 3. Mechanism of CD103+ cancer-specific T-cell cytotoxicity.
(A) Confocal imaging time-lapse of 1 μg SSX-2 antigen-loaded HCT116 cancer cells cocultured either CD103+ (top) or CD103− (bottom) SSX-2-specific T cells labelled with flou4-AM for calcium staining. Close-up images showing brightfield (top), flou4-AM stain (middle), and merged (bottom). Flou4-AM calcium staining shown in red. Scale bar: 10 μm, Blue dotted box indicates zoomed imaged area at magnification of 25X. (B) Amount of time (in seconds) required for first instance of 1 μg SSX-2 antigen-loaded HCT116 cancer cells cocultured either CD103+ (top) or CD103− (bottom) SSX-2-specific T cells. N1, number of events collected for CD103+ T cells: 29; N2, number of events collected for CD103− T cells: 29 (N, number of repeats=3; at 95% percentile). (C) Confocal imaging time-lapse 1 μg SSX-2 antigen-loaded HCT116 cancer cells cocultured either CD103+ (top) or CD103− (bottom) SSX-2-specific T cells labelled with Annexin V. Close-up images showing brightfield (top), Annexin V (middle), and merged (bottom) at 3,4,5,6,9,12 hours after coculture. Annexin V staining shown in blue. Scale bar: 10 μm. Blue dotted box indicates zoomed imaged area, at magnification of 25X. (D) Normalized annexin V intensity representing HCT116 cell death across a 12-hour time period following 1 μg SSX-2 antigen-loaded of HCT116, and cocultured either CD103+ (top) or CD103− (bottom) SSX-2-specific T cells A close-up detailing 2–8 hours coculture (N, number of repeats=3) is also shown. (E) Percentage of HCT116 cell death across a 12-hour time period following 1 μg SSX-2 antigen-loaded of HCT116, and cocultured either CD103+ (top) or CD103− (bottom) SSX-2-specific T cells (N, number of repeats=3). Data represented as median±S.E.M. *p-value<0.05; **p-values<0.01; ***p-values<0.001; ns, not significant. P-values were calculated using either paired student t-test with Wilcoxon adjustments, one-way or two-way ANOVA with Tukey post hoc analysis.

