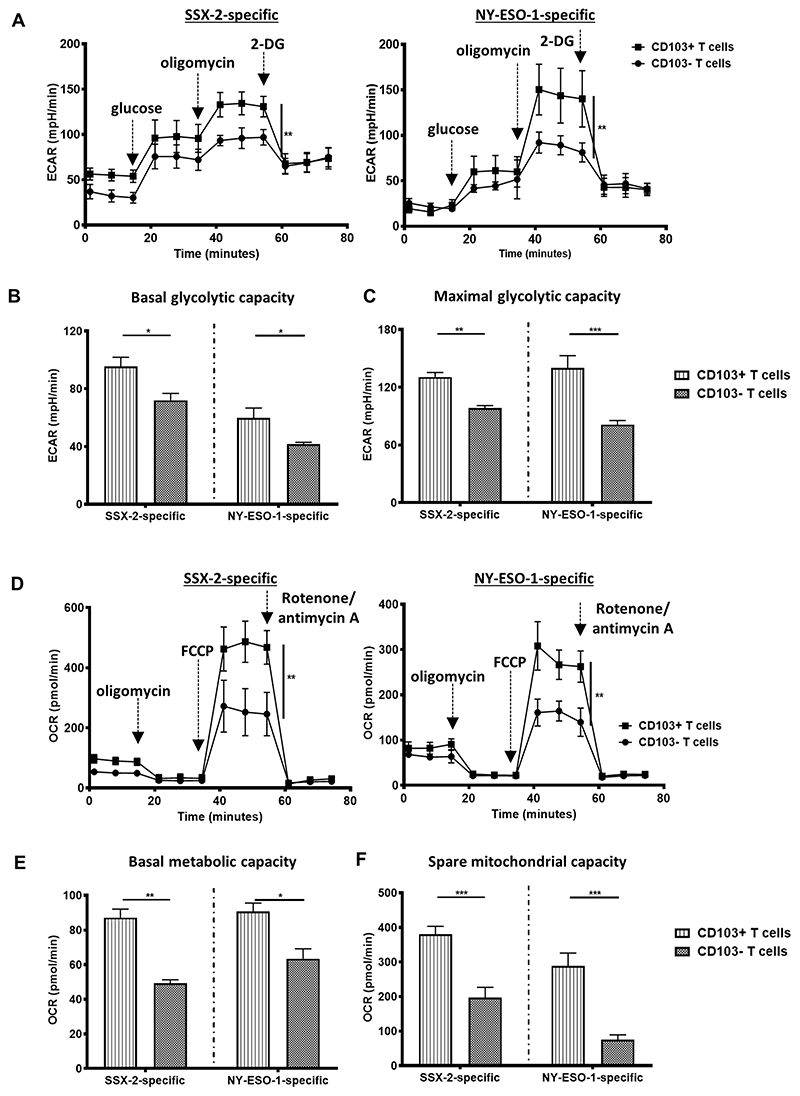
Figure 4. Metabolic activities of CD103+ cancer-specific T cells.
(A) The extracellular acidification rates (ECAR) of antigen-stimulated CD103+ or CD103− T cells across an 80-minute period. SSX-2 (left) and NY-ESO-1 (right)(N, number of repeats=3). Injection of glucose, oligomycin, and 2-DG into cells are indicated. The ECAR of (B) basal glycolytic capacity and (C) the maximal glycolytic capacity of antigen-stimulated CD103+ or CD103− T cells (N, number of repeats=3). (D) The oxygen consumption rates (OCR) of antigen-stimulated CD103+ or CD103− T cells across an 80-minute period. SSX-2 (left) and NY-ESO-1 (right)(N, number of repeats=3). Injection of oligomycin, FCCP, and rotenone/antimycin A into cells are indicated. The OCR at (E) basal respiration stage and (F) the spare respiratory capacity of antigen-stimulated CD103+ or CD103− T cells (N, number of repeats=3). Data represented as median±S.E.M. *p-value<0.05; **p-values<0.01; ***p-values<0.001; ns, not significant. P-values were calculated using either paired student t-test with Wilcoxon adjustments, one-way or two-way ANOVA with Tukey post hoc analysis.

