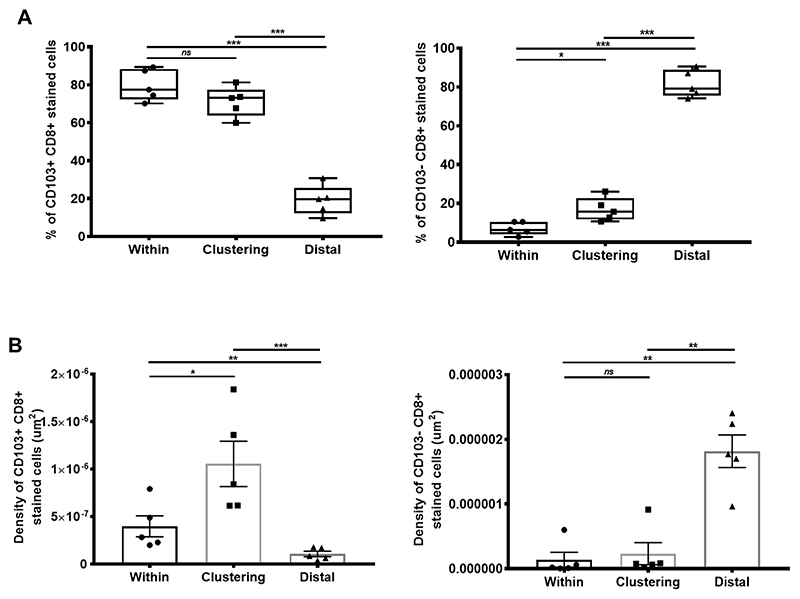
Figure 6. CD103+ CD8+ TILs localize on E-Cadherin rich tumors.
(A) Proportion of CD103+CD8+ T cells (left) or CD103−CD8+ T cells (right) present either within, clustering around, or distal of E-cadherin+ cells. (N, number of patients=5; at 95% percentile). (B) Density (by μm2) of CD103+CD8+ T cells (left) or CD103−CD8+ stained cells (right) present either within, clustering around, or distal of E-cadherin+ cells (N, number of patients=5). Data represented as median±S.E.M *p-value<0.05; **p-values<0.01; ***p-values<0.001; ns, not significant. P-values were calculated using one-way ANOVA with Tukey post hoc analysis.

