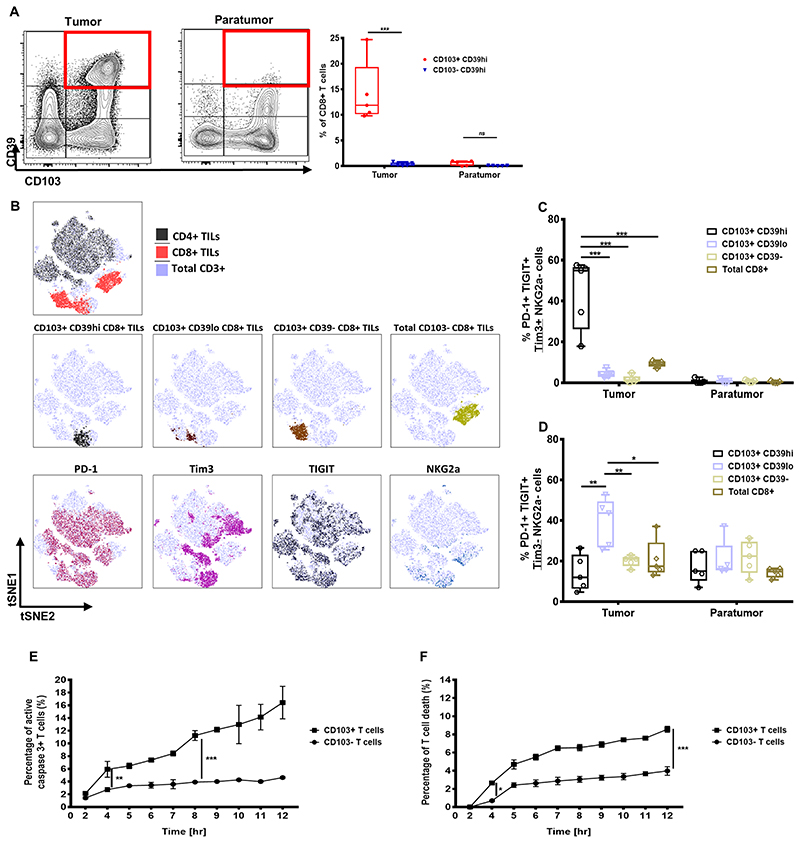
Figure 7. Ex vivo CD103+ TILs phenotype and in vitro analysis of T cell death.
(A) Representative flow cytometry contour plots of CD39 and CD103 expression on total CD8+ TILs derived from either tumor or paratumor tissues (left and middle), with graph showing frequency of CD8+ TILs co-expressing CD39 and CD103 across five different lung cancer patients (N, number of patients=5, at 95% percentile). (B) Representative tSNE plots identifying total CD3+, CD8+, and CD4+ TILs (top); CD103+CD39high, CD103+CD39low, CD103+CD39−, and total CD103−CD8+ TILs (middle); and PD-1–, Tim3-, TIGIT-, and NKG2A-expressing TILs. (C) Proportion of PD1+TIGIT+Tim3+NKG2A− cells in CD103+CD39high, CD103+CD39low, CD103+CD39−, or total CD8+ TILs derived from paired tumor and paratumor (N, number of patients=5; at 95% percentile). (D) Proportion of PD1+TIGIT+Tim3−NKG2A− cells in CD103+CD39high, CD103+CD39low, CD103+CD39−, or total CD8+ TILs derived from paired tumor and paratumor (N, number of patients=5, at 95% percentile). The proportion of (E) activated caspase-3+ T-cells and (F) T-cell death following coculture with HCT116 (that was loaded with 1μg SSX-2 antigen) across a time period of 12 hours (N, number of repeats=3). In A, C, D, E, and F), data represented as median±S.E.M. *p-value<0.05; **p-values<0.01; ***p-values<0.001; ns, not significant. P-values were calculated using either one-way or two-way ANOVA with Tukey post hoc analysis.

