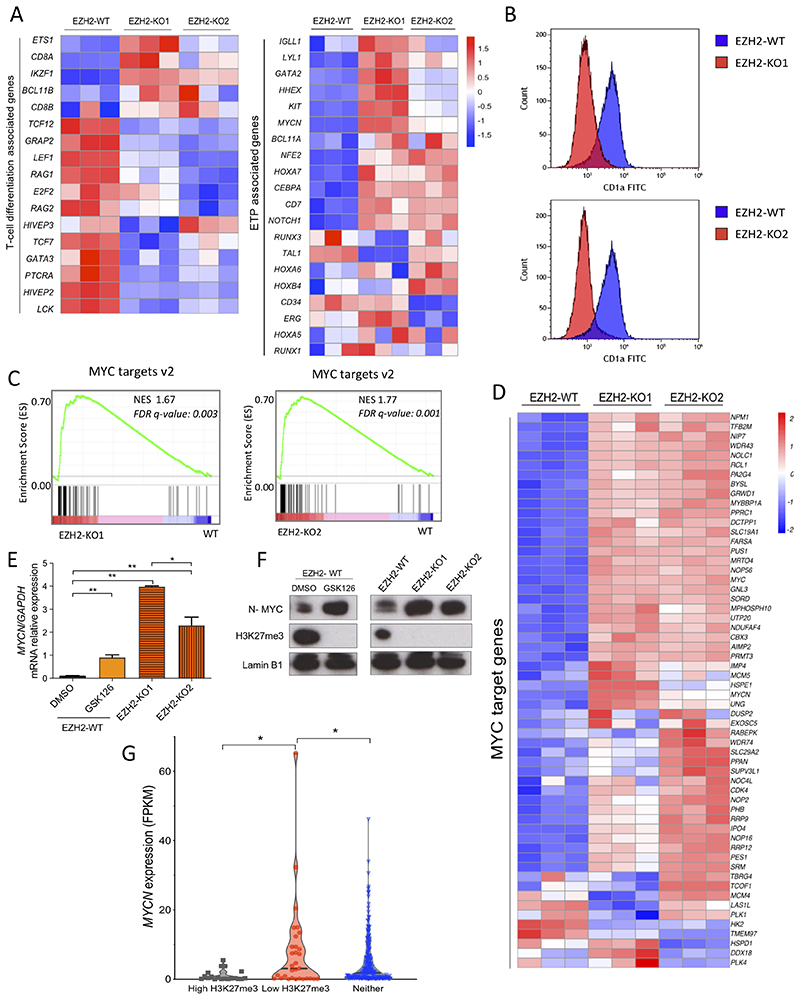
Figure 5. EZH2 loss leads to an ETP-ALL signature and increased expression of MYCN.
A) Differential mRNA expression heatmap of T-cell differentiation and ETP associated genes (as per Casero et al., 2015 and Ha et al., 2017) from RNA-seq data of EZH2-WT versus EZH2-KO1 and EZH2-KO2 Jurkat cells (n=3). B) Flow cytometric histograms for the cortical thymic marker CD1a in both EZH2-KO1 and EZH2-KO2 Jurkat cell lines in comparison with EZH2-WT isogenic control cells. C) Gene set enrichment analysis (GSEA) of MYC target genes v2 from EZH2-KO1 and EZH2-KO2 versus EZH2-WT Jurkat cells. NES, normalized enrichment score; FDR q-value, false discovery rate q value. D) Heatmap visualization of the upregulation of MYC target genes v2 (as per the Molecular Signatures Database) in EZH2-KO1 and EZH2-KO2 Jurkat cells as compared to Jurkat EZH2-WT cells. E) MYCN mRNA expression (relative to GAPDH) analyzed by Q-PCR of Jurkat EZH2-WT cells treated with EZH2 inhibitor GSK126 (2μM) or DMSO (control) for 7 days and compared with Jurkat EZH2-KO1 and EZH2-KO2 clones. **P < 0.01 by two-tailed Student’s t-test. F) Western blot of lysates of MYCN, H3K27me3 and Lamin B1 loading control from cells treated as in (E). G) MYCN expression in FPKM from the pediatric and young adult T-ALL patients cohort reported in Liu et al., 2017. Patients were sub grouped according to the presence of mutations (identified by exome sequencing) or deletions (based on DNA copy number analysis of SNP array data) potentially leading to low H3K27me3 levels (Low H3K27me3, n = 31), mutations or deletions leading to high H3K27me3 (High H3K27me3, n = 19) or neither of them (Neither, n = 210). Statistical significance was assessed by two-tailed Student’s t-test. *P value < 0.05.

