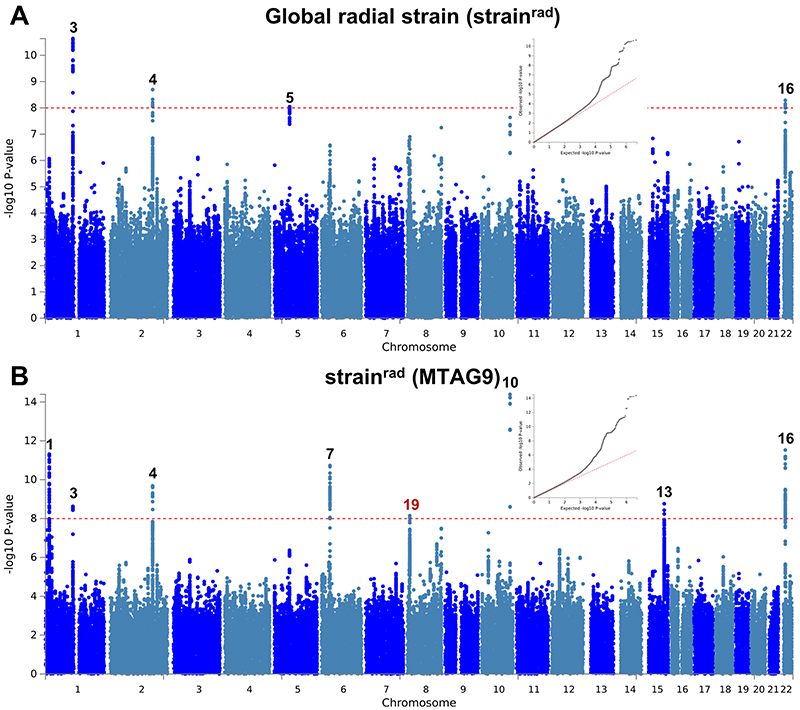
Extended Data Fig. 8. Manhattan and QQ plots of LV global radial strain GWAS and MTAG.
a,b, Summary results of the left ventricular global radial strain (strainrad) GWAS in the UK Biobank (n = 19,260) shown as Manhattan plots for the single trait (a) and the multi-trait analyses (MTAG; b). Single trait analysis (a) consisted of a fixed effects meta-analysis of case-control GWAS using a linear mixed model (BOLT-LMM), and multi-trait analysis results (b) were obtained using MTAG including summary statistics for all nine left ventricular (LV) traits. Red dashed line shows the significance threshold of P = 1 × 10⁻⁸. Quantile-quantile (QQ) plots shown as inserts in corresponding panels. Genomic inflation (λ) = 1.049 (single-trait) and 1.057 (MTAG). Numbering of signals as shown in Supplementary Table 8. Black numbers refer to loci reaching the statistical significance threshold in any single trait analysis, while red numbers refer to loci only reaching statistical significance in the multi-trait analysis.

