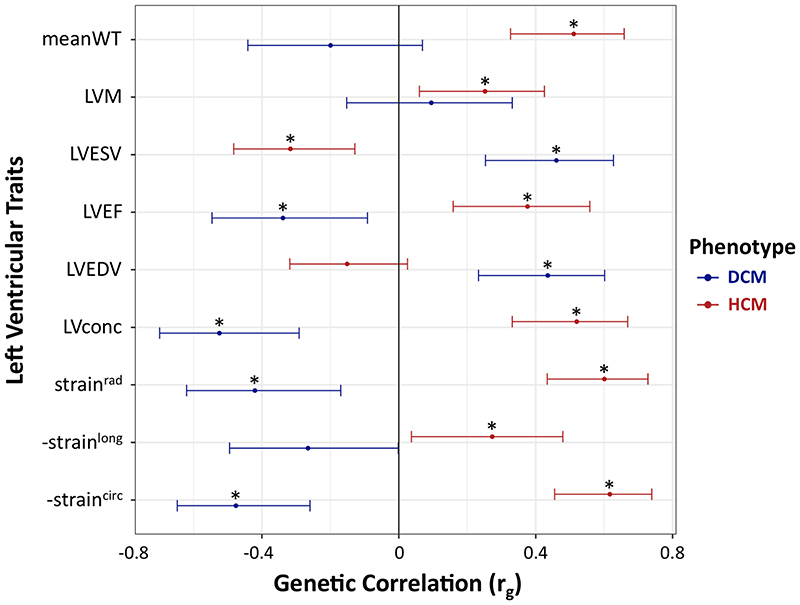
Figure 3. Genetic correlation between left ventricular traits, hypertrophic cardiomyopathy, and dilated cardiomyopathy.
Hypertrophic cardiomyopathy (HCM, red bars) and dilated cardiomyopathy (DCM, blue bars) show strong genetic correlations with quantitative cardiac left ventricular (LV) traits measured in the general population, but with opposite effects. Center values are the estimated genetic correlation (r g), and error bars indicate 95% confidence intervals. Samples sizes for included GWAS are as follows: 1,733 cases and 6,628 controls for HCM; 5,521 cases and 397,323 controls for DCM; and 19,260 for LV traits. Asterisks identify significant genetic correlations with a Benjamini–Hochberg false discovery rate (FDR) < 0.05. Data shown correspond to that in Supplementary Table 9. DCM, dilated cardiomyopathy; straincirc, strainlong and strainrad, global circumferential, longitudinal and radial strain, respectively (measures of contractility based on myocardial deformation); HCM, hypertrophic cardiomyopathy; LV, left ventricular; LVconc, LV concentricity (defined as LVM/LVEDV); LVEDV, LV end-diastolic volume; LVEF, LV ejection fraction (a volumetric measure of contractility); LVESV, LV end-systolic volume; LVM, LV mass; meanWT; mean LV wall thickness. Since straincirc and strainlong are always negative values, -straincirc and -strainlong are plotted to facilitate interpretation of effect direction.

