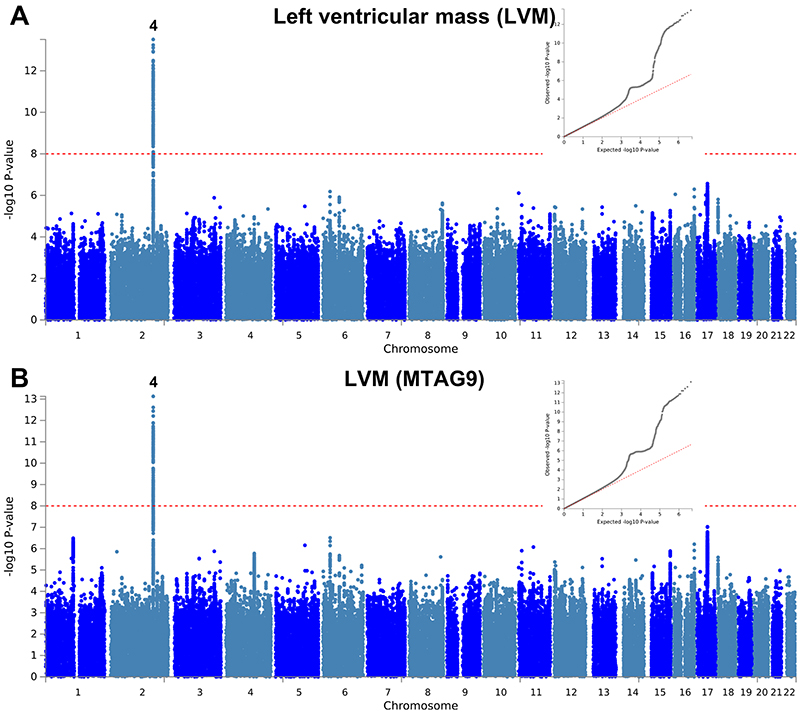
Extended Data Fig. 4. Manhattan and QQ plots of LV mass GWAS and MTAG.
a,b, Summary results of the left ventricular mass (LVM) GWAS in the UK Biobank (n = 19,260) shown as Manhattan plots for the single trait (a) and the multi-trait analyses (MTAG; b). Single trait analysis (a) consisted of a fixed effects meta-analysis of case-control GWAS using a linear mixed model (BOLT-LMM), and multi-trait analysis results (b) were obtained using MTAG including summary statistics for all nine left ventricular (LV) traits. Red dashed line shows the significance threshold of P = 1 × 10⁻⁸. Quantile-quantile (QQ) plots shown as inserts in corresponding panels. Genomic inflation (λ) = 1.081 (single-trait) and 1.071 (MTAG). Numbering of signals as shown in Supplementary Table 8.

