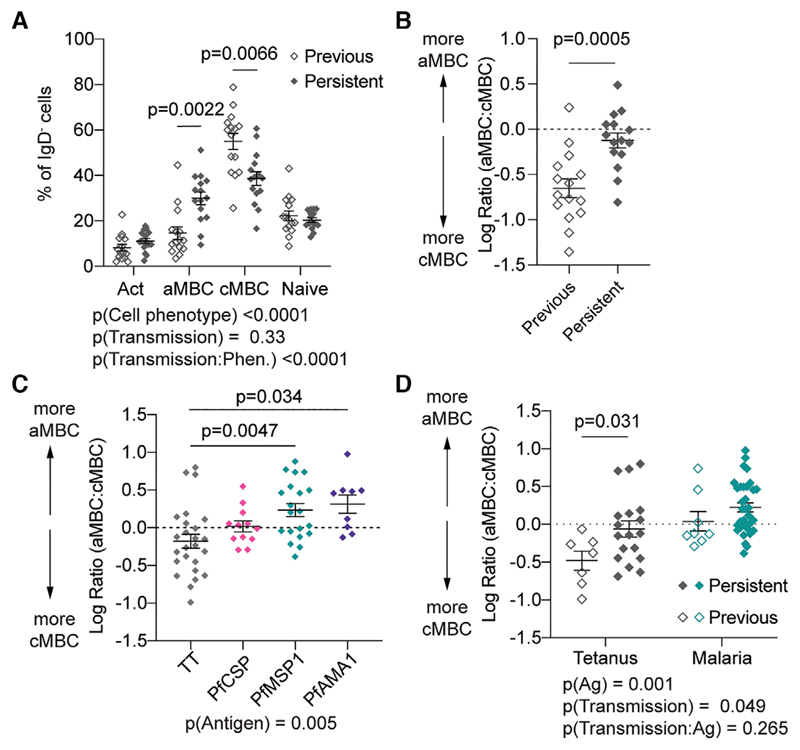
Figure 2.
Ag exposure and malaria transmission drive the atypical phenotype in B cells. PBMCs from the 30 individuals (15 previously exposed; 15 persistently exposed in one experiment) described in Fig. 1 were analysed for the phenotype of bulk and Ag-specific B cells. (A) Percentages of bulk IgD− B cells that have the cMBC, aMBC, activated and naïve phenotypes in individuals exposed to moderate and low levels of malaria transmission; mean ± SEM shown; analysis was via two-way ANOVA with Tukey post-test controlling for subject as a random effect; details of the model are given below the graph. (B) Log ratio of aMBC to cMBCs among bulk IgD− B cells in individuals exposed to low and moderate levels of malaria transmission. Mean ± SEM shown; analysis via Student’s t-test. (C) Log ratio of aMBC to cMBCs among Ag-specific B cells pooled from all donors, regardless of transmission status who had detectable levels of circulating Ag-specific B cells. Data are presented as mean ± SEM with analysis via one-way ANOVA with Tukey post-test controlling for subject as a random factor with pairwise comparisons made to the TT (control) group; n = 66 observations, observations were only included if there were >10 Ag-specific cells/sample. (D) Log ratio of aMBC to cMBCs among malaria-specific (pooled from PfCSP, PfMSPl and PfAMAl) and TT-specific B cells segregated by the levels of malaria exposure; mean ± SEM shown and analysed via two-way ANOVA with Tukey post-test controlling for subject as a random effect, details of the model are given below the graph.

