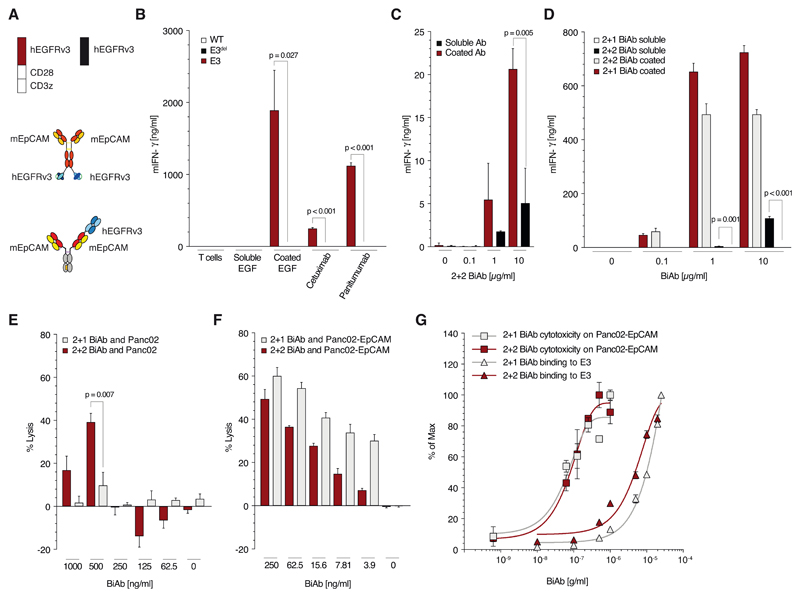
Figure 2. Antibodies monovalent (vs. bivalent) for binding SAR avoid tumor-antigen independent T cell activation.
(A) Schematic overview of the constructs used in panels B to G: trivalent (2+1 format) and a tetravalent (2 + 2 format) anti-EpCAM x anti-EGFRvIII BiAb as well as the constructs E3 and E3del. (B) Quantitative analysis of E3, E3del or untransduced T cell activation when cultured with coated or soluble human EGF or different anti-EGFR antibodies (cetuximab or panitumumab, all at 10μg/ml) for 48 h. (C) Culture of E3 T with either immobilized or soluble 2 + 2 BiAb in increasing concentrations (0, 0.1, 1 or 10 μg/ml). (D) Quantification of E3 T cell activation when cultured with either coated or soluble 2 + 2 BiAb or 2 + 1 BiAb in increasing concentrations (0, 0.1, 1 or 10 μg/ml). (E, F) Co-culture of Panc02-OVA (E) or Panc02-OVA-EpCAM+ (F) tumor cells with E3 T cells (E:T 5:1) preloaded with decreasing amounts (1, 0.5, 0.25, 0.125 or 0.062 μg/ml) of either 2 + 2 BiAb or 2 + 1 BiAb. (G) Saturation curve analysis of E3 T cells for 2 + 2 BiAb and 2 + 1 BiAb BiAb in relation to the lysis curves of Panc02-OVA-EpCAM+ tumor cells.
All graphs show mean values ± SEM of at least triplicates. Cytotoxicity analysis E and F were performed in quadruplicates. Experiments shown are representative of at least three independent experiments. p-values by two-sided unpaired t-test are indicated. p<0.05 was considered statistically significant.

