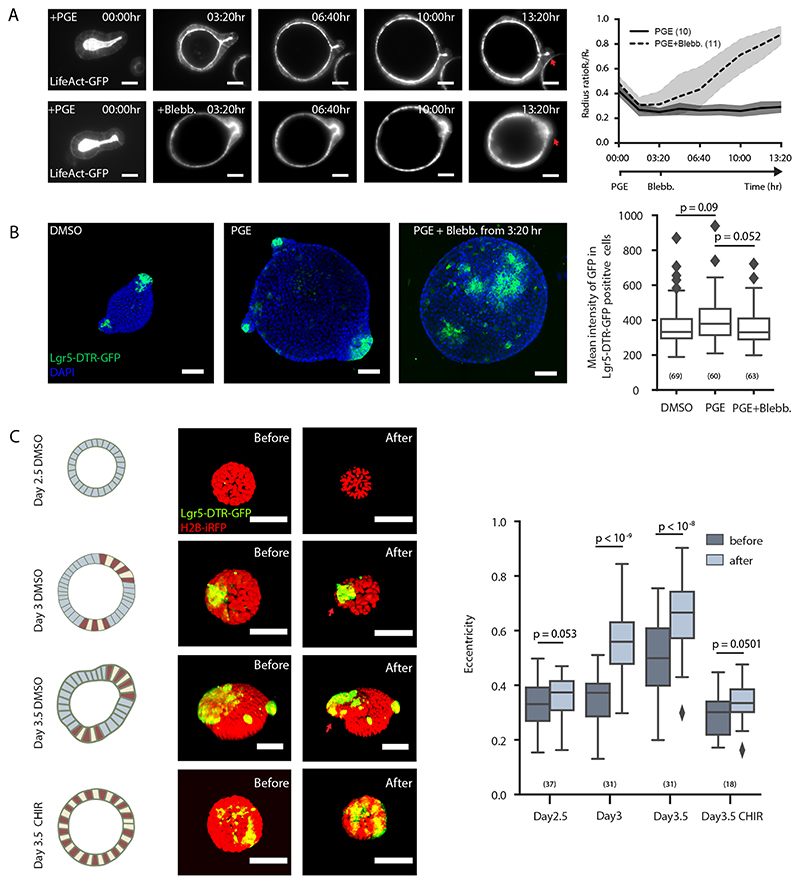
Figure 6. Coordination of lumen volume reduction and region-specific spontaneous curvature promotes crypt morphogenesis.
A. Actomyosin maintains crypt morphology in inflated budded organoid. Images, time-lapse recording of budded LifeAct-GFP organoid treated with PGE to inflate lumen (upper panel) or PGE (whole time) and Blebbistatin at 3:20 hrs (lower panel). Plot, corresponding plot for radius ratio (R c/R v) of the organoids. Lines in the middle represent the average values, shadow regions represent the standard deviations. B. Lgr5-DTR-GFP in inflated organoid with or without spontaneous curvature. Images, representative Lgr5-DTR-GFP organoids cultured in DMSO control, PGE or PGE + Blebbistatin (from 3:20 hr) condition with DAPI staining. Box plot, quantification of Lgr-5-DTR-GFP intensity in three groups from left images. C. Osmotic deflation in organoids with different spontaneous curvatures. Cartoon and images from upper to lower panels: Day2.5 DMSO-treated organoid, Day3 organoid before bulging, Day3.5 bulged organoid, and Day3.5 CHIR-treated organoid without bulging. Colours in the cartoon: red (Paneth cell), yellow (stem cell), blue (cell in villus tissue). Organoid images, fluorescent images of organoid expressing Lgr-5-DTR-GFP and H2B-iRFP before and after osmotic shock. Plot, quantification on eccentricity of organoids before and after osmotic shock. Red arrows in D and F indicate crypt regions. For plots (A-C), n numbers are stated in brackets and represent the number of independent recordings (A) or independent organoids (B and C) selected for measurements. P-values are calculated from two-tailed t-test (B) or two-tailed Paired Student’s t-test (C). Box-plot elements show 25% (Q1, upper bounds), 50% (median, black lines within the boxes) and 75% (Q3, lower bounds) quartiles, and whiskers denote 1.5× the interquartile range (maxima: Q3 + 1.5× (Q3-Q1); minima: Q1-1.5× (Q3-Q1)) with outliers (rhombuses). Experiments in A-C were repeated at least 3 times independently with similar results. Scale bars, 50 μm.

