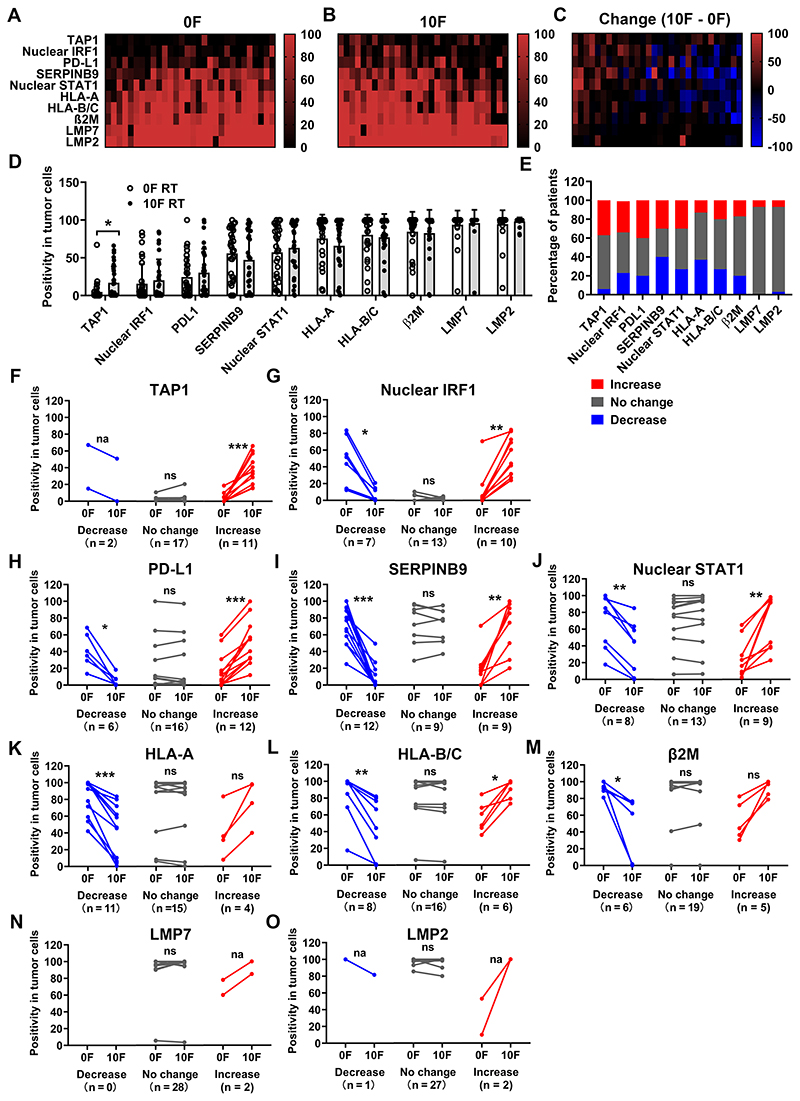
Figure 4. Immune marker expression positivity in tumor cells before and during CCRT.
Heatmaps of expression positivity of indicated immune markers in tumor cells before (A) and after 10F RT (B), and their dynamic changes (C). Patients were ranked according to their mean changes of positivity from the highest on the left to the lowest on the right. Markers were ranked according to their mean positivity of the whole cohort of patients from the lowest on the top to the highest on the bottom. The vertical color bars display the range of values. N = 30.
(D): Summary of the positivity of these markers in tumor cells before and after 10F RT.
(E): Summary of the dynamic change (10F vs 0F) patterns (increase, no change and decrease) of these markers. Increase (in red): positivity increased by > 10%; Decrease (in blue): positivity decreased by > 10%; No change (in gray): Changes of positivity ≤ 10%.
Comparisons of marker expression positivity before and after 10F RT in subgroups with different dynamic change patterns (decrease, no change and increase) are summarized in (F-O). The markers and case numbers (N) for each change pattern are indicated.
Mean comparisons in (D) (paired groups with normal distribution) were performed by using the paired Student’s t test. Mean comparison in (F-O (paired groups with uncertain distribution normality) was performed by using the Wilcoxon matched-pairs signed rank test.
ns: P > 0.05; * P < 0.05; ** P < 0.01; *** P < 0.001; na: the comparison is not applicable.
P values are not shown if they > 0.05 in (D).

