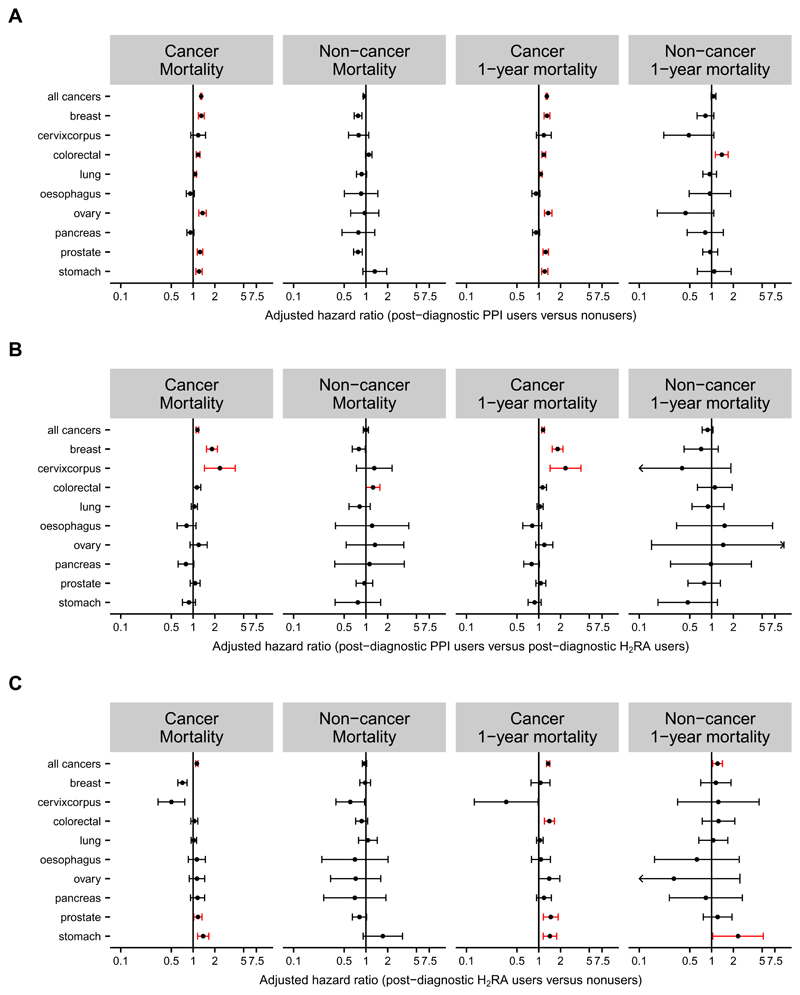
Figure 1. HRs for cancer-specific and non-cancer mortalities among users of PPIs or H2RAs.
Forest plots show adjusted HRs and 95% CIs for cancer-specific and non-cancer mortality among Danish cancer patients estimated using Cox proportional hazards regression models and stratified according to nine major cancer sites.
(A) Values for PPI users with ≥2 PPI prescriptions within 0-6 months after the cancer diagnosis compared to PPI nonusers with <2 PPI prescriptions in the same period.
(B) Values for PPI users with ≥2 PPI prescriptions within 0-6 months after the cancer diagnosis compared to H2RA users with ≥2 H2RA prescriptions in the same period.
(C) Values for H2RA users with ≥2 H2RA prescriptions within 0-6 months after the cancer diagnosis compared to nonusers with <2 H2RA prescriptions in the same period.
The corresponding values for figures A and B are shown in Supplementary Table 2 and unadjusted estimates for cancer mortality for post-diagnostic PPI and H2RA users versus nonusers in Supplementary Figures 2A and B.

