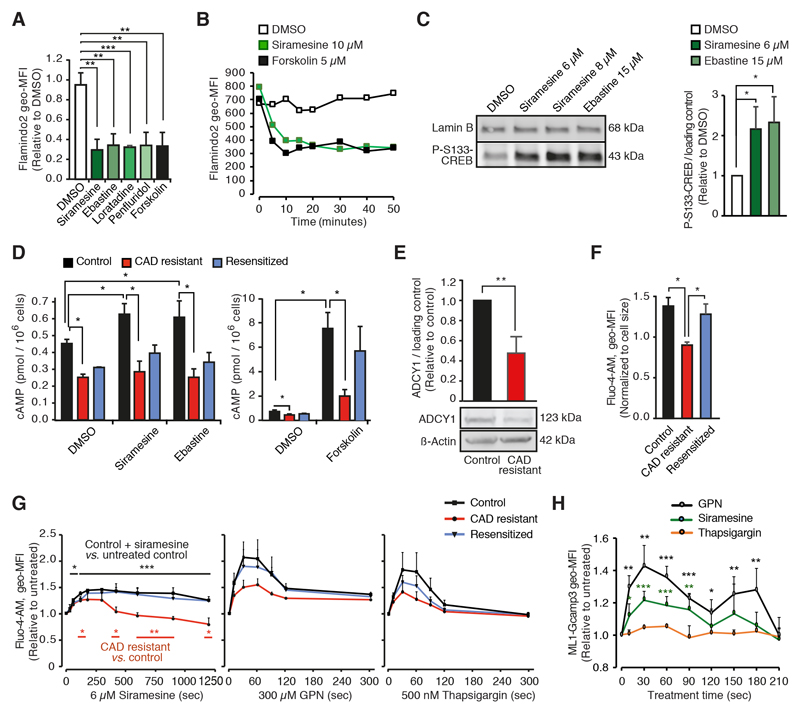
Figure 2. CAD resistance is associated with reduced intracellular cAMP and Ca2+ levels.
(A) Geometric mean fluorescence intensities (geo-MFIs) in MCF7-Flaminodo2 cells treated with DMSO, 6 μM siramesine, 15 μM ebastine, 40 μM loratadine, 8 μM penfluridol or 5 μM forskolin for 20 min in the absence of extracellular Ca2+ were analyzed by flow cytometry. The values are presented relative to DMSO-treated cells. Representative flow cytometer profiles are shown in Fig. S2A.
(B) Kinetics of geo-MFIs in MCF7-Flamindo2 cells treated as indicted in the absence of extracellular Ca2+ were analyzed as in (A). Data from one representative experiment is shown (N = 3).
(C) Representative immunoblots of P-S133-CREB and lamin B (loading control) in lysates of MCF7 cells treated as indicated for 2 h (left) and quantification of band intensities (P-S133-CREB/loading control; right).
(D) cAMP levels in control, CAD resistant and re-sensitized MCF7 cells treated for 20 min with DMSO, 10 μM siramesine or ebastine, 8 μM penfluridol or 2 μM forskolin in the absence of extracellular Ca2+ were analyzed by HitHunter® immunoassay. Standard curve for cAMP luminescence is shown in Fig. S2C.
(E) Representative immunoblots of ADCY1 and ß-actin (loading control) in lysates of control and CAD resistant MCF7 cells (top) and quantification of band intensities (ADCY1/loading control; bottom).
(F and G) Fluo-4-AM geo-MFIs in indicated cells left untreated (F) or treated with 6 μM siramesine (G, left), 300 μM GPN (G, middle) or 500 nM thapsigargin (G, right) in the absence of extracellular Ca2+ for indicated times were analyzed by flow cytometry.
(H) ML1-Gcamp3 geo-MFIs in MCF7 cells transfected with ML1-Gcamp3 for 72 h prior to the treatments with 6 μM siramesine, 300 μM GPN or 50 nM thapsigargin in the absence of extracellular Ca2+. The values are normalized to cell size (F) or relative to untreated cells (G). The ability of 50 nM thapisgargin to induce Ca2+ release and lysosomal localization of ML1-Gcamp3 are shown in Figs. S2G and S2H, respectively.
Error bars, SD of ≥ 3 independent experiments. * P < 0.05, ** P < 0.01, *** P < 0.001 as analyzed by 2-tailed, homoscedastic student’s t-test.

