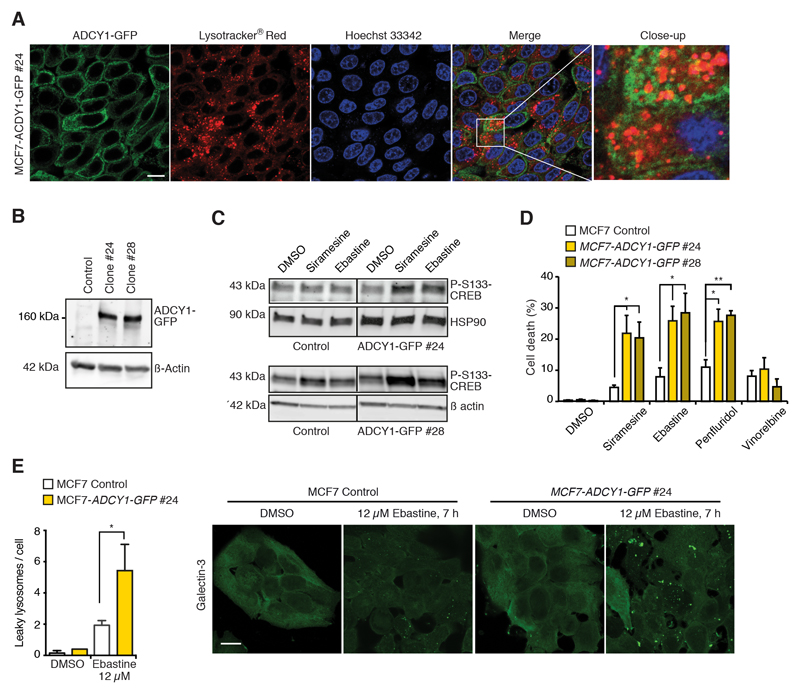
Figure 5. Ectopic ADCY1 enhances CAD-induced cAMP response and cell death.
(A) Representative images of MCF7-ADCY-GFP #24 cells stained with Lysotracker® Red and Hoechst 33342. Scale bar, 10 μm.
(B) Representative immunoblots of ADCY1-GFP, ADCY1 and β actin (loading control) in control MCF7 cells and indicated stable ADCY1-GFP expressing clones.
(C) Representative immunoblots of P-S133-CREB and HSP90 or β actin (loading controls) in indicated MCF7 clones treated with DMSO, 4 μM siramesine (top), 6 μM siramesine (bottom) or 10 μM ebastine (top and bottom). Vertical lines indicate a cut in the blot, but both sides originate from the same blot.
(D) Death of indicated MCF7 clones treated with DMSO, 4 μM siramesine, 12 μM ebastine, 6 μM penfluridol or 30 nM vinorelbine for 48 h.
(E) Quantification (left) and representative images (right) of lysosomal galectin-3 puncta in indicated MCF7 clones treated with DMSO or 12 μM ebastine for 7 h and stained for galectin-3 and LAMP2. See Fig. S4C for LAMP2 and merged LAMP2 and galectin-3 stainings. Scale bar, 10 μm.
Error bars, SD of > 3 independent experiments. * P < 0.05, ** P < 0.01 as analyzed by 2-tailed, homoscedastic student’s t-test.

