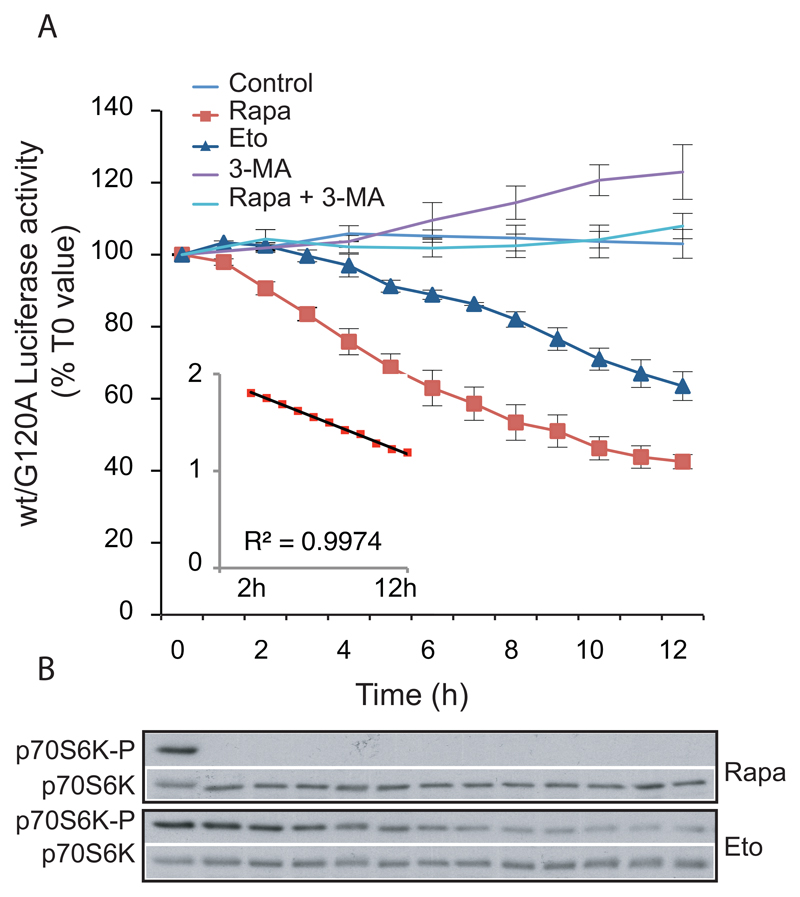
Figure 2. Analysis of the kinetics of autophagic flux in living cells.
A. MCF-7 cells stably expressing RLuc-LC3wt or Rluc-LC3G120A were plated as described in 6.2 step 1 and incubated with 50 nM of the live cell luciferase substrate EnduRen™ for 2 h prior to addition of either control medium (n = 3) or drug treatments: 250 nM Rapamycin (Rapa; n = 3), 50 μM Etoposide (Eto; n = 3), 10 mM 3-MA (n = 3) or 250 nM Rapamycin + 10 mM 3-MA (Rapa + 3-MA; n = 2). Luciferase activity was measured with 1–2 h intervals as indicated. The values represent the mean ratio ± SEM of luciferase activities from the two cell lines expressed as percentages of the corresponding ratio in untreated cells at T0. The insert is a representation of the logarithm (base 10) of the rapamycin values after subtraction of 27%, as a function of time (from 2 to 12 hours). The trendline and the corresponding R2 were calculated with excel software. The value “27%” represents a hypothetical steady state of wt/G120A luciferase activity in the presence of rapamycin (established as the value giving a trendline with an R2 closest to 1).
B. Immunoblotting with antibodies against p70S6K-P (Cell Signaling, 9206) and p70S6K (Cell Signaling, 9202) of proteins from MCF-7 cells treated with rapamycin (250 nM) or etoposide (50 μM) as above.
The figure is a partial reproduction of Figure 4 in our previous publication (Farkas et al., 2009) with a permission from the publisher.

