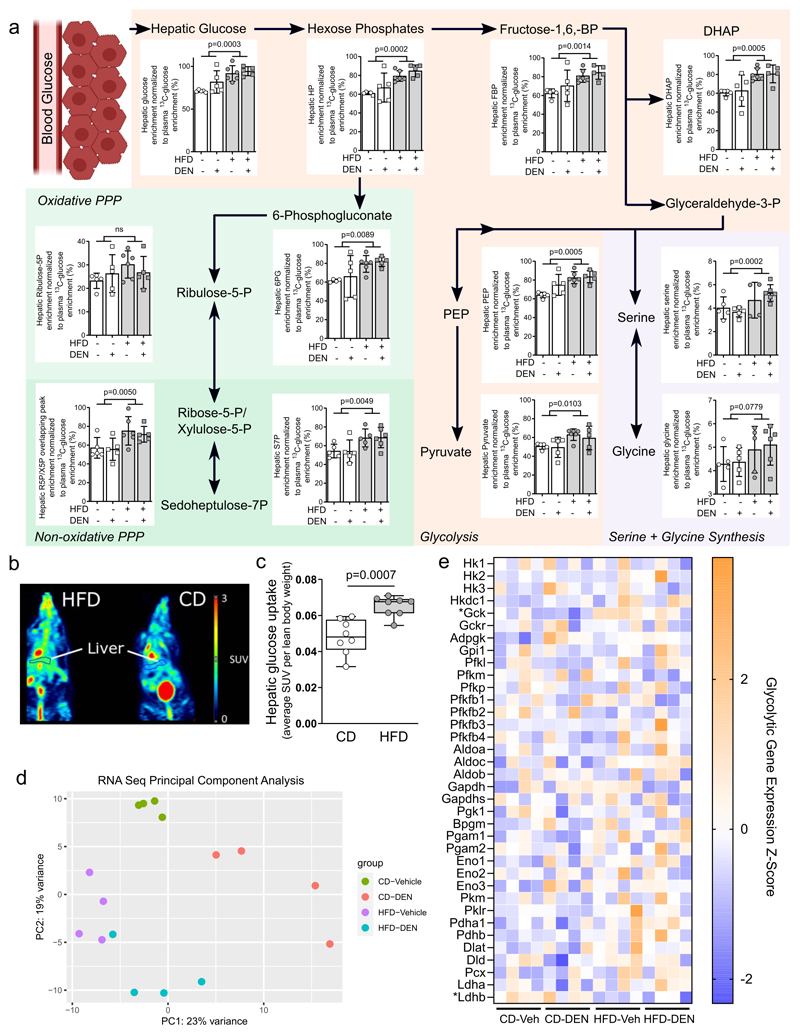
Figure 1. Fat hyperactivates glucose metabolism.
a) Metabolic differences detected in liver tissue of mice after 8-weeks on CD (CD-vehicle n=5, CD-DEN n=5) or HFD (HFD-vehicle n=7, HFD-DEN n=6) diet normalized to plasma glucose enrichment. Abbreviations: BP, bisphosphate; FBP, fructose-1,6-bisphosphate; DHAP, dihydroxyacetone phosphate; PEP, phosphenolpyruvate; HP, Hexose phosphates; R5P, ribuose-5-phosphate; X5P, Xylulose-5-phosphate; S7P, sedoheptulose-7-phosphate; 6PG, 6-phoshogluconate; PPP, pentose-phosphate pathway. p-value statistics indicate variance caused by diet effect in two-way ANOVA testing.
b,c) 18F-fluorodeoxyglucose positron emission tomography (18F-FDG-PET) of mice after eight weeks of control (n=8) or high fat (n=8) diet. Representative images highlighting the region that was selected to assess hepatic 18F-FDG uptake, normalized to lean weight of each mouse. Statistics: Two-tailed unpaired Student’s T-test.
d) Principle component analysis of transcriptomics dataset from bulk RNA sequencing of liver tissue from CD-vehicle, CD-DEN, HFD-vehicle and HFD-DEN. n=4 per group. X and Y axes indicate the amount of variance accounted for by the first and second components, in percentage.
e) Heat map of genes involved in glycolysis expressed as Z-score. * indicates p-adjusted value < 0.05 from DESeq analysis testing for a diet effect.

