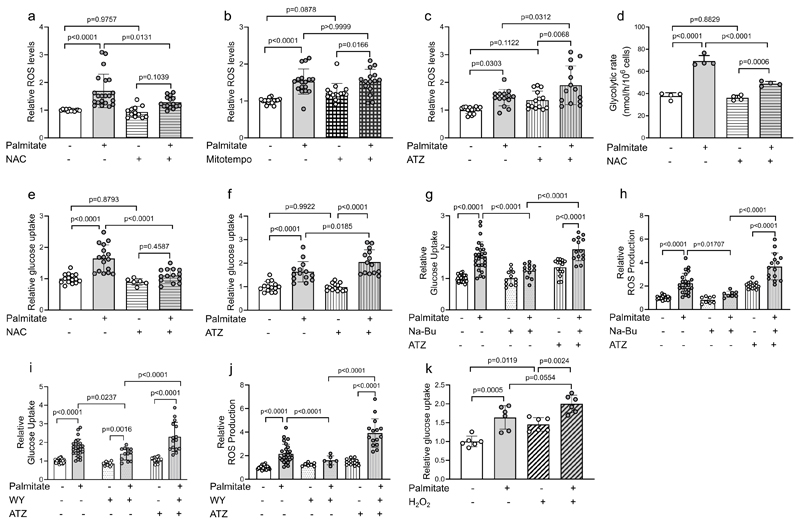
Figure 6. ROS production is required for the hyperactivation of glucose metabolism upon palmitate supplementation.
a-c) Reactive oxygen species (ROS) in H4IIEC3 cells treated with 0.4 mM palmitate and/or NAC (5 mM) (n=22, 21, 12, 15 individual replicates for vehicle, palmitate, vehicle + NAC and NAC + palmitate groups, respectively), Mitotempo (n=18, 15, 14 and 15 individual replicates for vehicle, palmitate, mitotempo and mitotempo + palmitate, respectively) or ATZ (20 mM) (n=14 individual replicates for each group) normalized to control.
d) Glycolytic rate in H4IIEC3cells treated with 0.4 mM palmitate and/or NAC (5 mM) (n=4 individual replicates for each group).
e) Glucose uptake in H4IIEC3cells treated with 0.4mM palmitate and/or NAC (5 mM) (n=6 with individual replicates plotted for each group) normalized to control.
f) Glucose uptake in H4IIEC3cells treated with 0.4 mM palmitate and/or 3-ATZ (20 mM) (n=14 individual replicates for each group) normalized to control.
g-j) Relative glucose uptake and ROS production in in H4IIEC3cells pre-treated for 24-hours with sodium butyrate (Na-Bu, 5mM) or WY-14643 (WY, 100μM) followed by 8-hour treatment with 0.4mM palmitate and ATZ (20mM). (n=3-6 with individual replicates plotted for each group) normalized to control. Statistics: two-way ANOVA with Fisher LSD post-hoc testing, with p-values as indicated.
k) Relative glucose uptake in cells treated with 0.4 mM palmitate and/or H2O2 (2 mM) (n=6 with individual replicates plotted) normalized to control.
Unless otherwise noted, one-way ANOVA with Tukey’s multiple comparisons with p-values for multiple comparisons as indicated.

