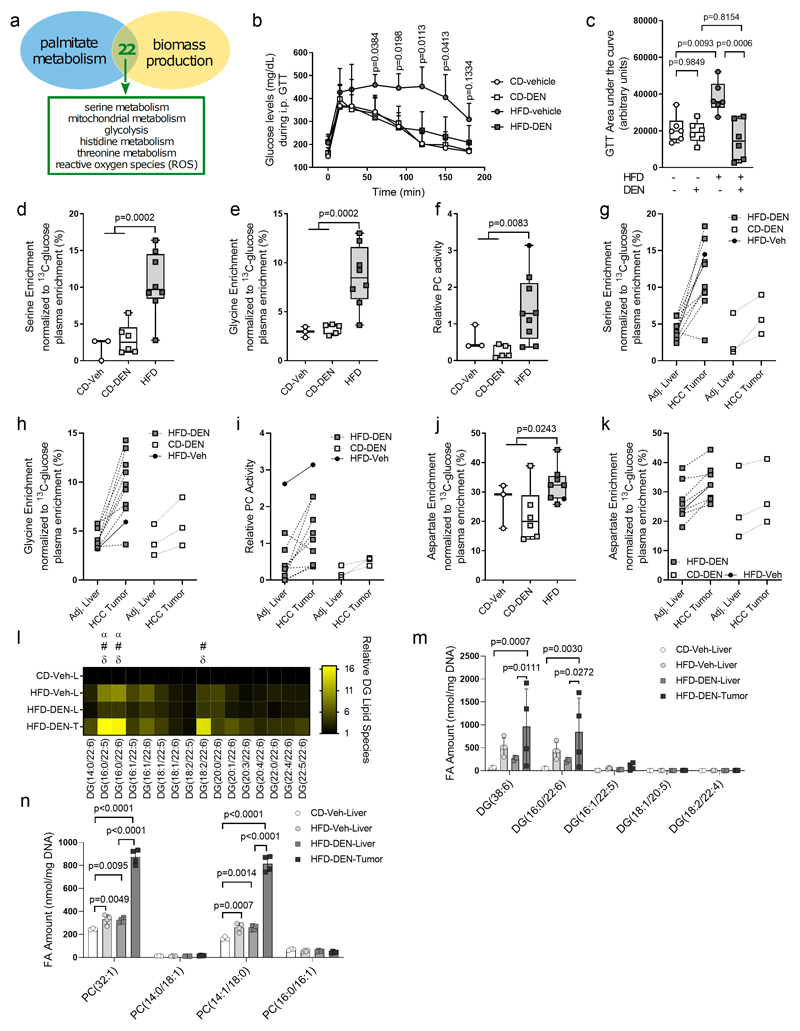
Figure 7. Metabolic pathways induced by fat in non-transformed mouse livers are hallmarks of HCC.
a) In silico predictions of common metabolic pathways between cells supplemented with palmitate and cells maximizing biomass production based on 22 common metabolic intermediates.
b-c), Intraperitoneal glucose tolerance test in mice after 29 weeks on CD (CD-vehicle, n = 6; CD-DEN, n = 6) or HFD (HFD-vehicle, n = 6; HFD-DEN, n = 6) with DEN or vehicle exposure. Data are expressed as the mean of measured blood glucose levels (mg/dL) and the AUC. Statistics, two-way ANOVA followed by Dunnett’s multiple comparisons, with P values for HFD-vehicle compared with CD-vehicle as indicated in B and one-way ANOVA with Tukey’s multiple comparisons test with P values represented in c.
d-f) Serine biosynthesis with conversion to glycine normalized toward the 13C enrichment of plasma glucose and pyruvate carboxylase (PC) activity in normal liver (CD-vehicle, n = 3; CD-DEN, n = 6) or HCC tumor tissue [HFD-vehicle, n = 1 (full-black circle); HFD-DEN, n = 9 (PC activity) or n = 8 (serine biosynthesis with conversion to glycine)] of mice after 29 weeks on CD with DEN or vehicle exposure. Statistics, two-tailed unpaired Student t test comparing CD to HFD.
g-i) Serine biosynthesis with conversion to glycine normalized toward the 13C enrichment of plasma glucose and PC activity in matched pairs of HCC tumor and adjacent normal liver tissue of mice after 29 weeks on CD (n = 3) or HFD (n = 8) with vehicle or DEN exposure. In two HFD mice, two tumors were analyzed and one HFD-vehicle mouse (solid-black dot and line) was included.
j) Aspartate synthesis normalized toward the 13C enrichment of plasma glucose from glucose in normal liver (CD-vehicle, n = 3; CD-DEN, n = 6) or HCC tissue [HFD-vehicle, n = 1 (full-black circle); HFD-DEN, n = 7] of mice after 29 weeks on CD with DEN or vehicle exposure. Statistics, two-tailed unpaired Student t test comparing CD to HFD.
k) Aspartate synthesis normalized toward the 13C enrichment of plasma glucose from glucose in matched pairs of HCC tumor and adjacent normal liver tissue of mice after 29 weeks on CD (n = 3) or HFD (n = 8) with vehicle or DEN exposure. For two HFD-DEN animals, two tumors were analyzed and connected to the same adjacent liver sample and one HFD-vehicle mouse is included (solid-black circle and solid line).
I) Heat map with normalized diacylglycerides (DG) species that contain 22:5 and 22:6 acyl chains in CD-vehicle liver tissue (n = 3), HFD-vehicle liver tissue (n = 4), HFD-DEN liver tissue (n = 3), and HFD-DEN tumor tissue (n = 4), all normalized to CD-vehicle liver tissue. Statistics, two-way ANOVA with Tukey’s multiple comparisons testing. α, significant differences between CD-vehicle liver to HFD-vehicle liver; #, significant differences between CD-vehicle liver and HFD-DEN tumor tissue; δ, significant differences between HFD-DEN liver tissue and HFD-DEN tumor tissue, with P < 0.05 considered significant.
m-n) Total amounts of the sum notations of DG (38:6) and PC (32:1), and the specific lipid species that make up the sum notations in CD-vehicle liver tissue (n = 3), HFD-vehicle liver tissue (n = 4), HFD-DEN liver tissue (n = 4), and HFD-DEN tumor tissue (n = 4).
Statistics, two-way ANOVA with Tukey’s multiple comparisons tests, with P values represented.

