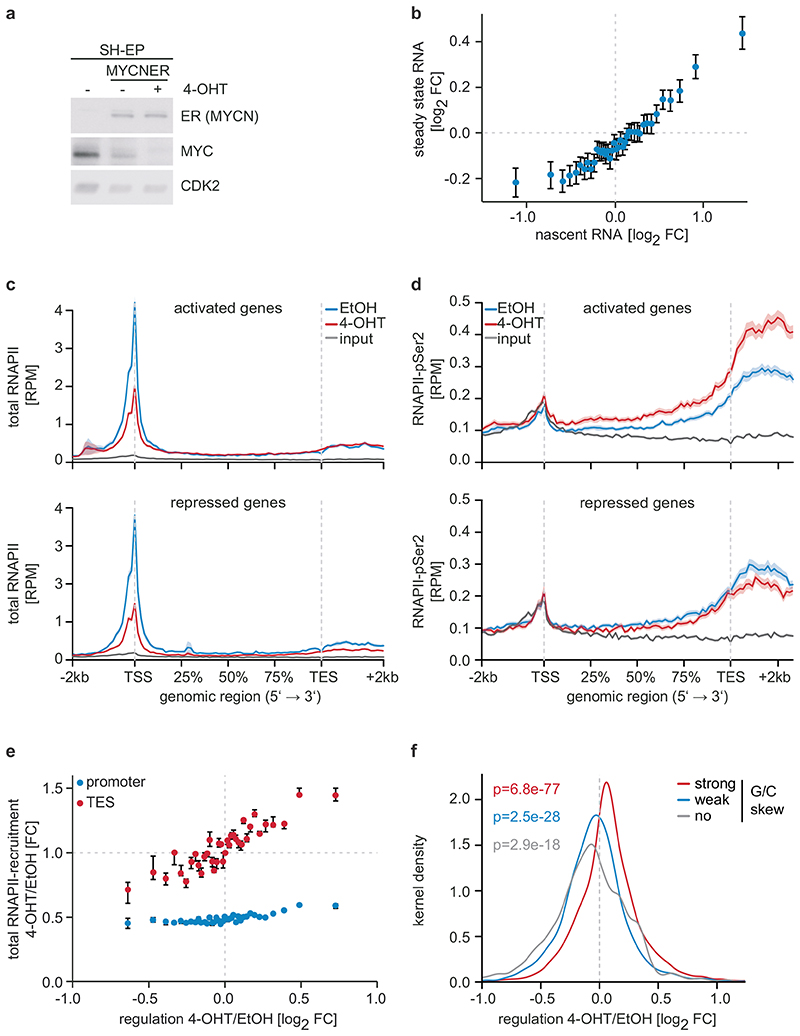
Figure 1. Effects of MYCN on gene expression and RNAPII function.
a: Immunoblot documenting MYC and MYCNER levels in SH-EP cells. Cells were treated with 200 nM 4-OHT or EtOH for 3 h. CDK2 is loading control (n=3; in all legends, n indicates the number of independent biological replicates).
b: Correlation between regulation by MYCN measured by nascent and steady-state RNA levels. 18,213 genes were binned and the mean including the 95 % confidence interval is plotted (n=3).
c: Metagene plots of total RNAPII after 4-OHT treatment (3 h) for the 914 most strongly MYCN-activated (top) and 615 repressed genes (bottom). For each genomic bin, the mean is plotted and the shadow illustrates SEM. RPM: reads per million mapped reads (n=4).
d: Metagene plots (mean+SEM as shadow) of RNAPII-pSer2 for MYCN-activated and -repressed genes (n=4).
e: Correlation of transcriptional changes and RNAPII occupancy at promoters and transcriptional end sites (TES) after MYCNER activation. 11,093 expressed genes were binned based on log2FC. Plots show median with bootstrapped 95 % confidence intervals with 1,000 re-samplings as error bars.
f: Kernel density plot regulation by MYCN of gene with promoters that have different G/C skews (strong:4,003; weak:3,381; no:1,377) (n=3). p-values were calculated with a two-tailed Wilcoxon one-sample signed-rank test with μ=0.

