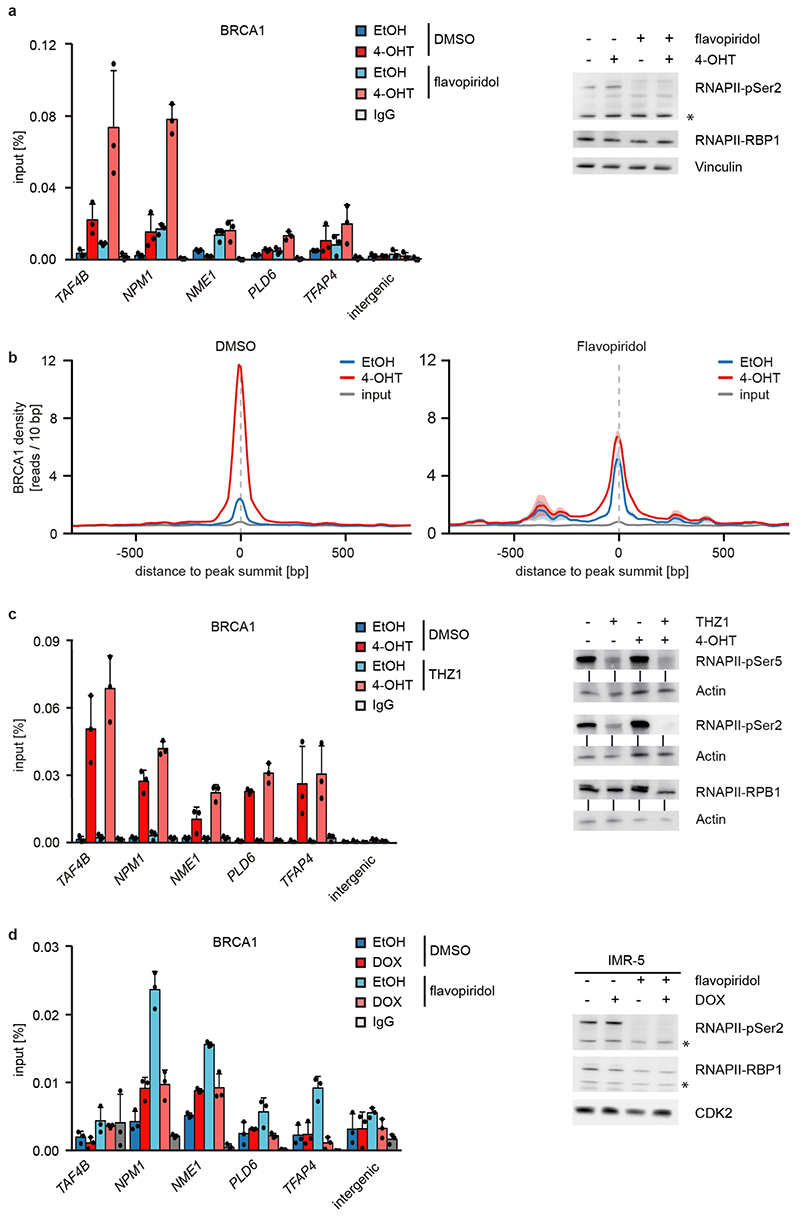
Extended Data Figure 6.
a: (Left) ChIP of BRCA1 at the indicated loci upon treatment of SH-EP MYCNER cells with 4-OHT (5 h) and flavopiridol (100 nM, 3 h) where indicated. Shown is the mean and error bars indicate SD of technical triplicates of one representative experiment (n=2). (Right) Immunoblot of cells treated as described. Asterisk denotes an unspecific band. Vinculin was used as loading control (n=1).
b: Density plots (mean+SEM as shadow) of BRCA1 occupancy in 6887 intergenic regions after treatment with either 4-OHT or EtOH (5 h) in (left) DMSO and (right) flavopiridol (100 nM, 3 h) treated cells (n=1).
c: (Left) ChIP of BRCA1 in SH-EP MYCNER cells treated with CDK7 inhibitor THZ1 (200 nM, 4 h) or DMSO as control together with 4-OHT or EtOH. Shown is the mean and error bars indicate SD of technical triplicates. (Right) Immunoblots for pSer5, pSer2 and total RNAPII after treatment as described above. Actin was used as loading control (n=1).
d: (Left) ChIP of BRCA1 at the indicated loci in MYCN-amplified IMR-5 neuroblastoma cells expressing a doxycycline-inducible shRNA targeting MYCN. Where indicated, cells were treated with flavopiridol (200 nM, 4 h) or doxycycline (1 μg/ml, 48 h). Shown is the mean and error bars indicate SD of technical triplicates of one representative experiment (n=2). (Right) Immunoblot of cells treated as described above. Asterisks denote unspecific bands. CDK2 was used as loading control (n=2).

