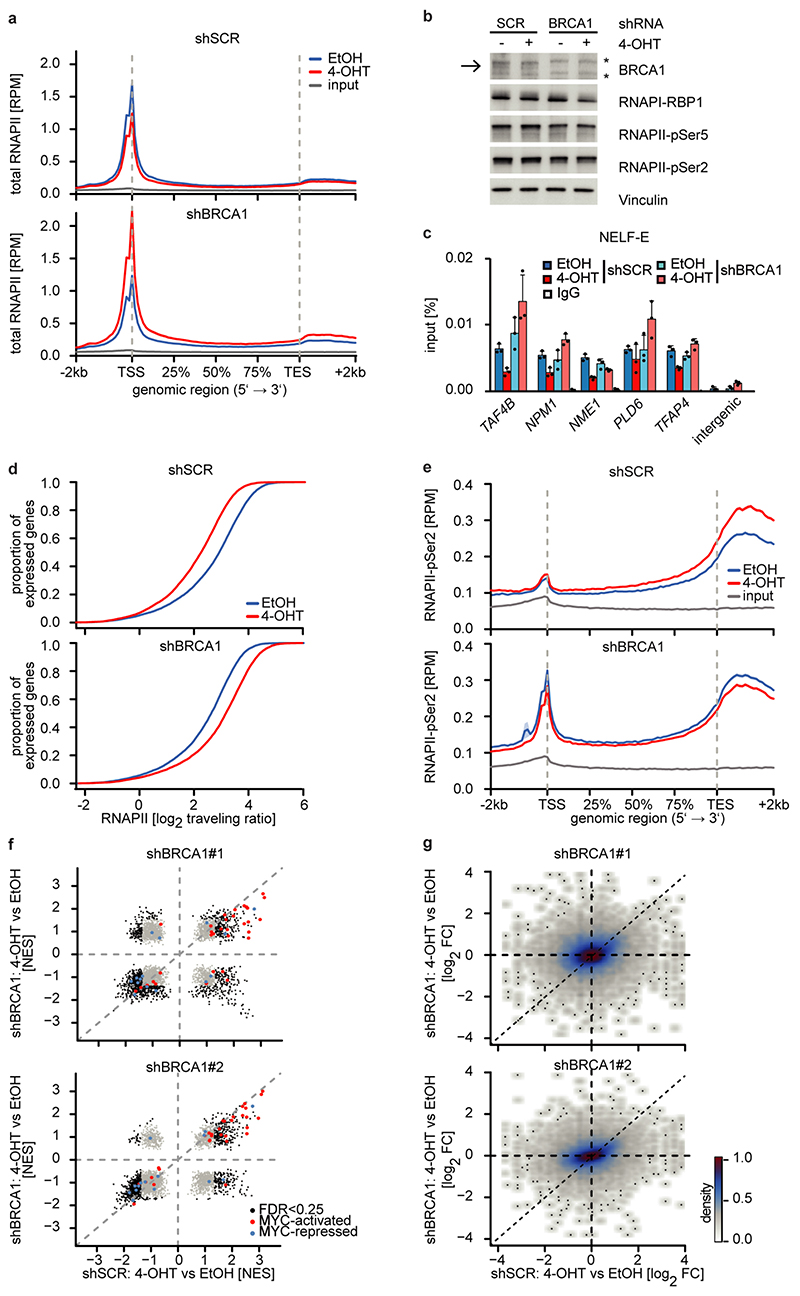
Extended Data Figure 7.
a: Metagene plots (mean+SEM as shadow) of total RNAPII after 4-OHT treatment (3 h) in control (top) and BRCA1-depleted cells with shBRCA1#1 (bottom) on 14,488 expressed genes.
b: Immunoblot of total RNAPII (RBP1) and phosphorylated forms after knockdown of BRCA1 and activation of MYCN. Shown is one representative experiment (n=2). The arrow points to the BRCA1 band, asterisks denote unspecific bands.
c: ChIP of NELF-E in control and BRCA1-depleted SH-EP MYCNER cells after 4-OHT treatment (4 h). Shown is the mean and error bars indicate SD of technical triplicates of one representative experiment (n=3 using two different shRNAs).
d: Empirical cumulative distribution function of RNAPII traveling ratio after MYCNER-activation (3 h) in control (top) and BRCA1-depleted (bottom) cells with shBRCA1#2 of 14,488 expressed genes.
e: Metagene plots (mean+SEM as shadow) of RNAPII-pSer2 in control (top) and BRCA1-depleted (bottom) cells with shBRCA1#2 upon treatment as described above on 14,488 expressed genes.
f: Gene-set enrichment analysis upon activation of MYCN (5 h) in BRCA1-depleted and control conditions (n=3). Significantly enriched gene sets are highlighted in black (FDR q-value <0.25), MYC-activated gene sets are marked in red and MYC-repressed in blue. FDR was calculated using a Kolmogorov-Smirnov test) with 1,000 permutations using a Benjamini-Höchberg correction for multiple testing.
g: 2D kernel density plot correlating gene expression changes after MYCNER-activation (5 h) in BRCA1-depleted and control cells. Results are shown for two shRNAs of 19,429 expressed genes. r: Pearson’s correlation coefficient.

