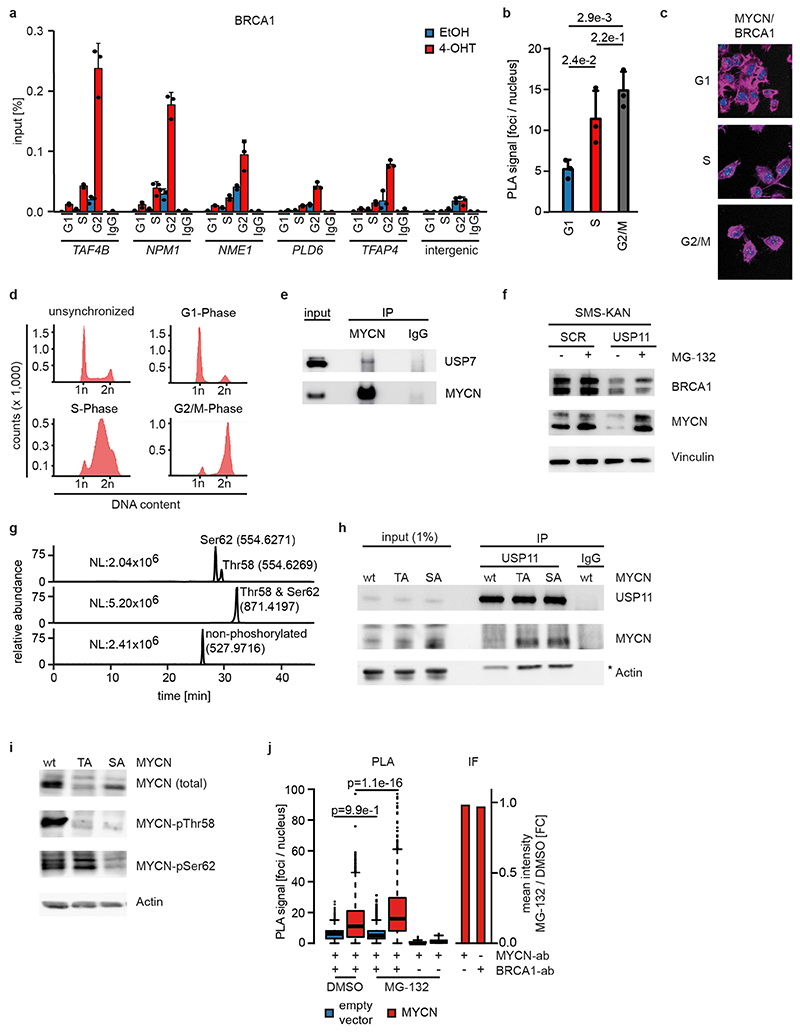
Extended Data Figure 9.
a: ChIP of BRCA1 in SH-EP MYCNER cells synchronized by a double thymidine block. Cells were released and harvested in the indicated cell cycle phase after 4 h of 4-OHT treatment. IgG was used as control. Shown is the mean and error bars indicate SD of technical triplicates (n=1).
b: Bar plot summarizing the proximity ligation assays of MYCN and BRCA1 in G1-, S- and G2-phase in SH-EP MYCNER cells synchronized as described above and upon 3 h 4-OHT treatment. The plot shows mean and error bars indicate SD of biological triplicates. For each cell cycle phase, between 74 and 276 cells were counted. P-values were calculated using an unpaired, two-tailed t-test (n=1).
c: Representative pictures of proximity ligation assay from panel b showing proximity of MYCN and BRCA1 in G1-, S- and G2-phase (green dots). Nuclei were stained with Hoechst, cytoskeleton was stained using phalloidin indicated in violet (n=1).
d: Representative FACS profiles of propidium-iodide stained SH-EP MYCNER cells used for the experiments above (n=1).
e: Immunoblot of α-MYCN immunoprecipitates from IMR-5 MYCN-amplified neuroblastoma cells. The input corresponds to 0.75 % of the amount used for the precipitation. Shown is one representative experiment (n=2).
f: Immunoblot of indicated proteins after knockdown of USP11 in SMS-KAN cells and treatment with MG-132 (10 μM, 6 h) where indicated. Vinculin was used as loading control (n=1).
g: Extracted ion chromatogram of MYCN phosphorylation status from SH-EP cells expressing ectopic MYCN. Values in brackets indicate m/z ratio for each peak and the normalized target level (NL) is given for each chromatogram (n=1).
h: Immunoblot of α-USP11 immunoprecipitates from SH-EP cells stably expressing wild-type MYCN (“wt”), Thr58Ala (“TA”) or Ser62Ala (“SA”) mutants of MYCN. Asterisk denotes an unspecific band. Shown is one representative experiment (n=3).
i: Immunoblot documenting phosphorylation status of the indicated alleles of MYCN. Actin was used as loading control. Shown is one representative experiment (n=2).
j: (Left) Quantification of a proximity ligation assay illustrating complex formation of BRCA1 with MYCN in SH-EP cells expressing ectopic MYCN or empty vector as control. Between 749 and 1854 cells were counted for each condition. p-values were calculated with a two-tailed Wilcoxon test. In the box plot, the central line reflects the median and the borders of the boxes show the interquartile range of the plotted data. The whiskers extend to 1.5x of the interquartile range and outliers are shown as dots. (Right) Quantification of the corresponding immunofluorescence signals of the indicated antibodies (n=1).

