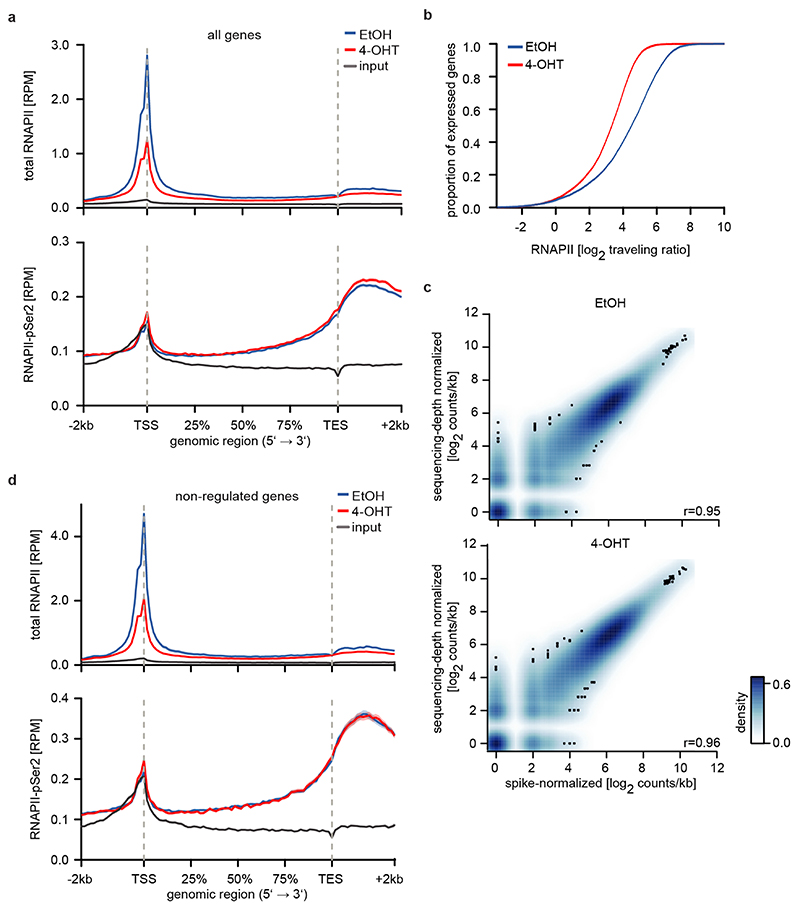
Extended Data Figure 2.
a: Metagene plots (mean+SEM as shadow) of total RNAPII (top) and RNAPII-pSer2 (bottom) in SH-EP MYCNER cells after 4-OHT treatment (3 h) for 14,488 expressed genes (n=4).
b: Empirical cumulative distribution function of RNAPII traveling ratio after MYCNER-activation (4-OHT) of 14,488 expressed genes (n=4).
c: 2D kernel density plot of total RNAPII occupancy at the TSS of 14,945 expressed genes in SH-EP MYCNER cells treated with EtOH (top) or after activation of MYCN (bottom). Samples are normalized either to sequencing depth or using a murine spike-in (n=1). r: Pearson’s correlation coefficient.
d: Metagene plots (mean+SEM as shadow) of total RNAPII (top) and RNAPII-pSer2 (bottom) in SH-EP MYCNER cells after 4-OHT treatment (3 h; n=4) of 1,000 non-regulated genes.

