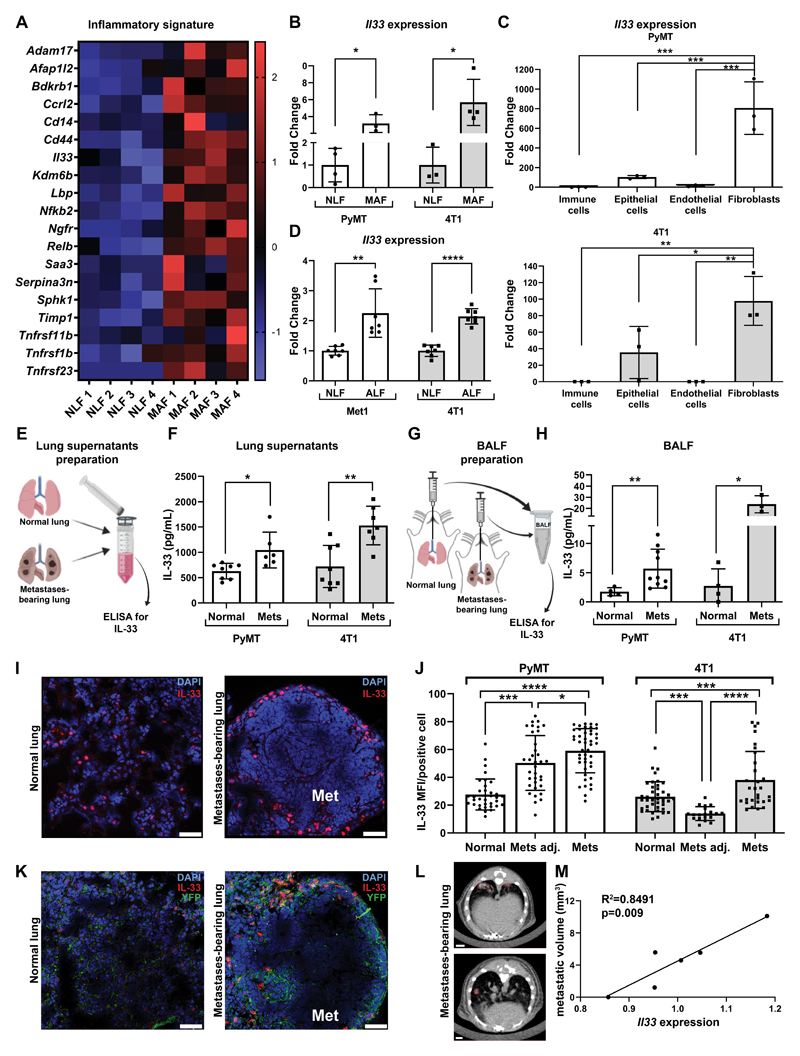
Figure 1. IL-33 is upregulated in metastases-associated fibroblasts at the lung metastatic microenvironment.
(A) Heatmap of inflammatory genes that were enriched in an unbiased GO analysis (GO:0006954, FDR=0.00045). Analysis was performed on genes significantly upregulated in MAF vs. NLF (FC>1.5, adjusted P<0.05). (B) Expression of Il33 in NLF and MAF sorted from MMTV-PyMT;Col1a1-YFP transgenic mice (n=3) vs. normal FVB/n;Col1a1-YFP controls (n=4) and BALB/c;Col1a1-YFP mice bearing 4T1 metastases (n=4) vs. BALB/c;Col1a1-YFP controls (n=3). Data are presented as fold change ± SD. Welch’s t-test, *p<0.05. (C) qRT-PCR analysis of Il33 expression in FACS sorted lung cell populations. Cells were isolated from MMTV-PyMT;Col1a1-YFP mice (n=3) or BALB/c;Col1a1-YFP mice bearing 4T1 tumor cell metastases (n=3). Data presented as mean ± SD, normalized to control immune cells; one-way ANOVA followed by Tukey’s multiple comparisons test. *p<0.05, **p<0.01, ***p<0.001. (D) qRT-PCR analysis of Il33 expression. White bars: FVB/n lung fibroblasts incubated with SFM (NLF, n=7) or with Met1 tumor cells CM (ALF- activated lung fibroblasts, n=6). Gray bars: BALB/c NLF incubated with SFM (n=7) or ALF (n=7) incubated with 4T1 tumor cells CM. Data presented as mean ± SD; Welch’s t-test. **P<0.01, ****p<0.0001. (E) Scheme of IL-33 ELISA in lung homogenate supernatants. (F) Quantification of IL-33 ELISA presented in E: FVB/n normal lungs (n=7) vs. MMTV-PyMT metastases-bearing lungs (Mets, n=6) and BALB/c normal lungs (n=8) vs. BALB/c mice bearing 4T1 metastases (n=7). Data presented as mean ±SD; Welch’s t-test. *P<0.05. **P<0.01. (G) Scheme of IL-33 ELISA in BALF. (H) Quantification of IL-33 ELISA presented in G: FVB/n normal lungs (n=4) vs. MMTV-PyMT metastases-bearing lungs (n=10) and BALB/c normal lungs (n=4) vs. BALB/c mice bearing 4T1 metastases (n=3). Data presented as mean ± SD; Welch’s t-test. *P<0.05, **P<0.01. (I) Representative images of IL-33 immunofluorescence staining in lungs. n=3 mice per group; Scale bars, 50μm. Cell nuclei, DAPI; IL-33, Rhodamine Red. (J) Quantification of mean fluorescent intensity (MFI) per IL33+ positive cell in staining performed in (I). FVB/n normal lungs vs. PyMT metastases-bearing lungs, and BALB/c normal lungs vs. mice bearing 4T1 lung metastases. 6-8 fields of view - FOV/lung were analyzed. Mets adj: lung areas without metastases, Mets: metastases. One-way ANOVA with Tukey’s correction for multiple comparisons. *P<0.05, **P<0.01, ***P<0.001, ****P<0.0001. (K) Representative images of IL-33 and YFP immunofluorescence staining in lungs. n=3 mice per group; Scale bars, 50μm. Cell nuclei, DAPI; IL-33, Rhodamine Red; YFP, Alexa Fluor-488 (L) Representative CT imaging of 4T1 lung metastasis. Metastases are marked in red. n=4. (M) Pearson correlation analysis between metastatic volume (mm3) measured by CT imaging presented in (L) and Il33 expression analyzed by qRT-PCR in total lungs.

