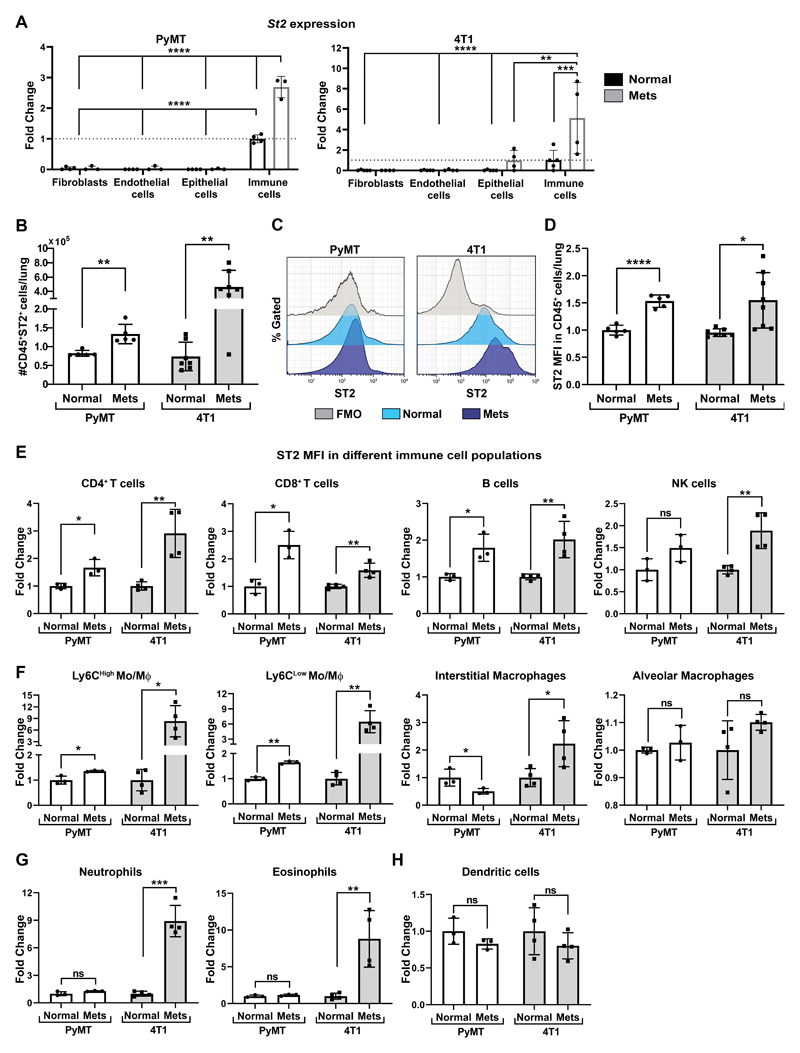
Figure 3. ST2, the IL-33 receptor is highly upregulated in immune cells at the metastatic microenvironment.
(A) qRT-PCR analysis of St2 expression in FACS sorted lung cell populations: immune cells (CD45+CD31-), endothelial cells (CD31+CD45-), epithelial/tumor cells (EpCAM+CD45- CD31-) or fibroblasts (YFP+CD45-CD31-EpCAM-). Cells were sorted by flow cytometry from MMTV-PyMT;Col1a1-YFP mice (n=3), FVB/n;Col1a1-YFP (n=4) or BALB/c;Col1a1-YFP mice bearing 4T1 tumor cell metastases (n=4) or normal BALB/c;Col1a1-YFP control (n=5). Data presented as mean ±SD normalized to control immune cells; one-way analysis of variance followed by Tukey’s multiple comparisons test. **p<0.01, ***p< 0.001, **** p <0.0001. (B) Flow cytometric analysis of the number of ST2+CD45+ immune cells in FVB/n normal lungs (n=5) vs. MMTV-PyMT metastases-bearing lungs (n=5) and BALB/c normal lungs (n=7) vs. BALB/c mice bearing 4T1 tumor cell metastases following orthotopic injection (n=7). Data presented as mean ±SD; Welch’s t-test **P<0.01. (C) Flow cytometry representative histogram of ST2 fluorescent intensity (MFI) out of total CD45+ immune cells in normal lungs and metastases-bearing lungs (Mets). Histograms of Normal and Mets represent individual mice. FMO-fluorescent minus one. (D) Quantification of flow cytometric analysis presented in (C). Each sample was normalized to FMO control and to normal control. Welch’s t-test, *P<0.05, ****p<0.0001. (E-H) Flow cytometric analysis of ST2 fluorescence intensity in immune cell populations in normal lungs and metastases-bearing lungs derived from FVB/n normal lungs (n=3) vs. MMTV-PyMT metastases-bearing lungs (n=3) and from BALB/c mice injected with 4T1 tumor cells (n=4) or control BALB/c mice (n=4). Lymphoid cells (E), Monocytes or Macrophages (F), Granulocytes (G), Dendritic cells (H). Gating strategy presented in Supplementary Fig. S2C,D. Each cell population was normalized to FMO control and to normal control. Multiple t-tests with Welch’s correction, FDR(Q)=5%. *q<0.05, **q<0.01, ***q<0.001, ns-not significant.

