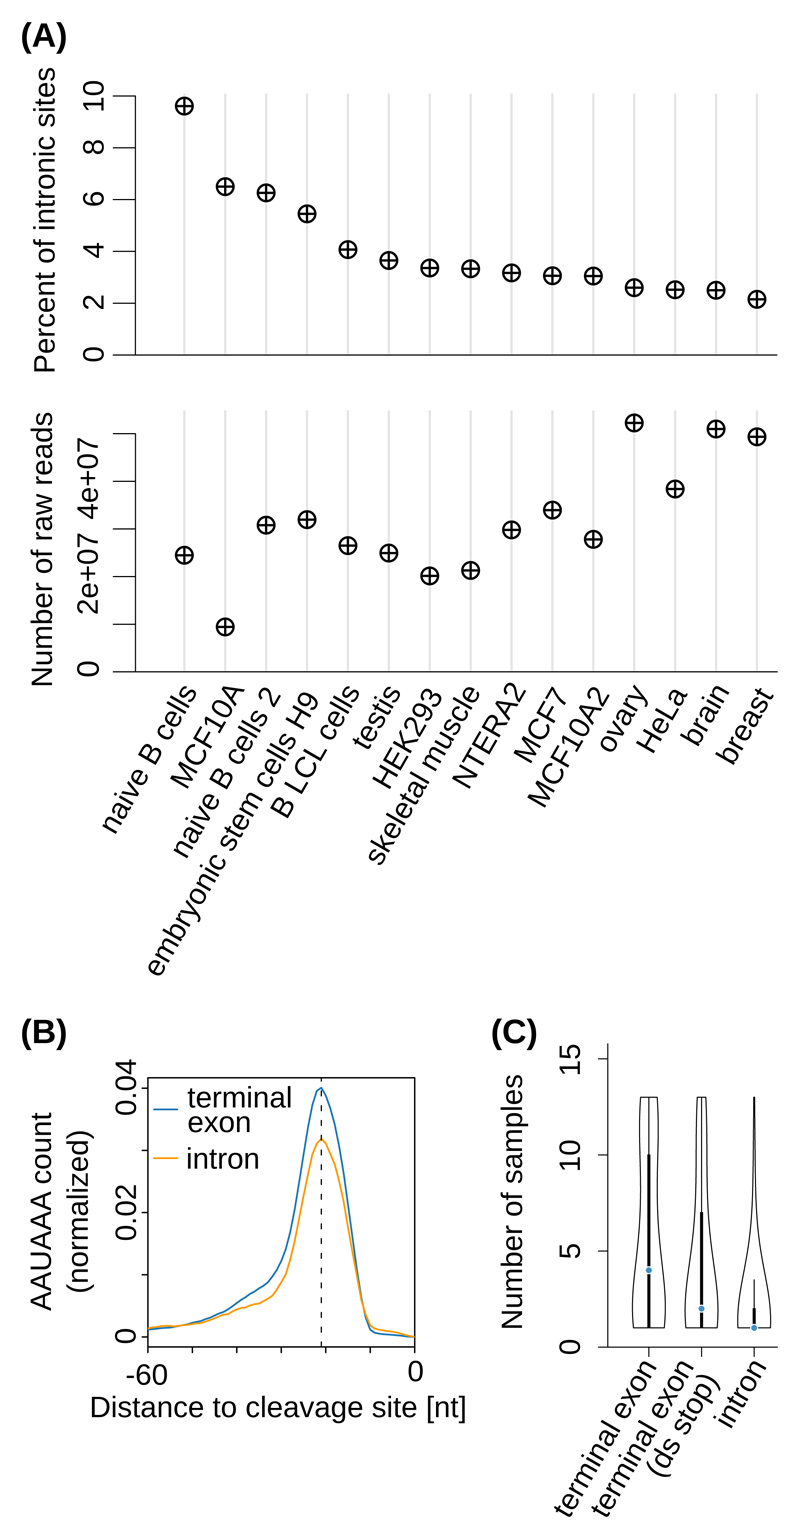
Figure 1. Cell type-dependent usage of ‘intronic’ poly(A) sites.
(A) Top panel: Percentage of ‘intronic’ PAS in individual samples obtained with the 3’-Seq protocol 17. Bottom panel: corresponding sequencing depths. (B) Position-dependent frequency of the canonical poly(A) signal (‘AAUAAA’), dashed line at -21 nts) upstream of ‘intronic’ poly(A) sites (orange) and of poly(A) sites from annotated terminal exons (blue) from the study introduced in (A). (C) Distribution of the number of distinct samples in which individual PAS were observed, for PAS from terminal exons with no stop codon annotated downstream (‘terminal exon’, 26894 PAS), from annotated terminal exons located upstream of an annotated stop codon in the corresponding gene (‘terminal exon (ds stop)’, 3430 PAS), and from genomic regions currently annotated as intronic (‘intron’, 3937 PAS). Black boxes indicate the interquartile range (IQR) with the blue line corresponding to the median, whiskers corresponding to 1.5 times the IQR from the hinge, and densities extending to the most extreme values.

