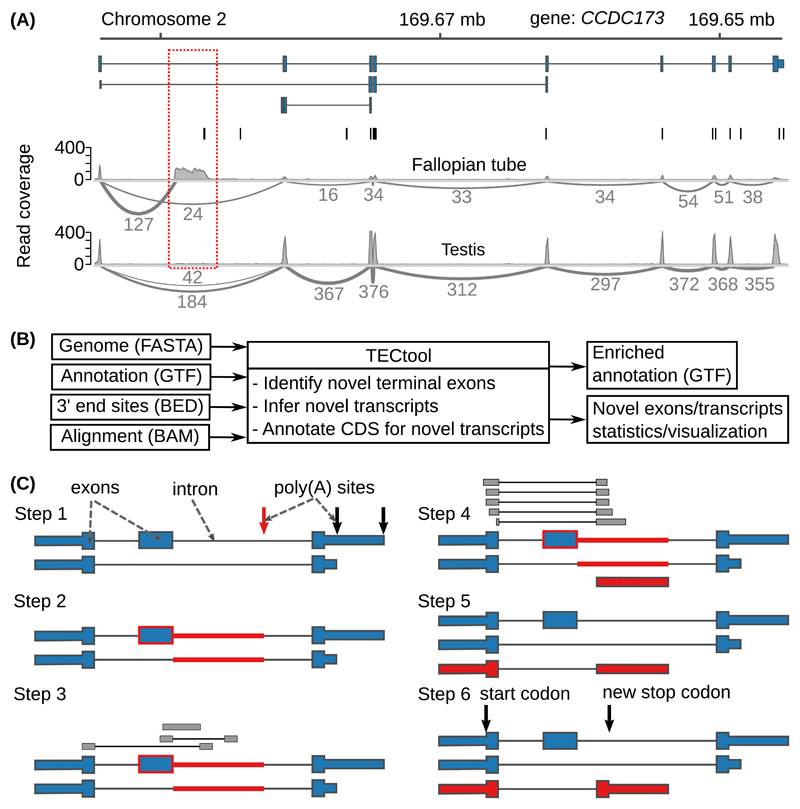
Figure 2. Example and model to identify novel 3’ UTR isoforms.
(A) ‘Sashimi plots’ 18 of RNA-seq reads mapped to a region within the Coiled-coil Domain Containing 173 (CCDC173) gene locus, with the annotated ENSEMBL transcripts (blue), the PAS annotated in the PolyAsite atlas (vertical black lines, http://polyasite.unibas.ch) and densities of RNA-seq reads (gray) from fallopian tube and testis samples. The novel terminal exon is marked by the red dashed box, gray arcs indicate putative splice junctions, and numbers on the arcs indicate supporting reads (for clarity, only splice junctions supported by at least 10% of the maximum number of split reads between two exons in the genomic locus are shown, see also Supplementary Figure 2A). (B) Flow of the data through TECtool (input and output file formats are indicated in parentheses). (C) Outline of the main computational steps: Step 1 - Selection of PAS located within regions that with respect to the input annotation (see ‘Annotation (GTF)’ in (B)), are ‘intronic’ (red arrow), and not exonic, intergenic or antisense (black arrows). Step 2 - Identification of the ‘feature’ region of the putative novel terminal exon (red line), extending from the ‘intronic’ poly(A) site up to the closest annotated exon upstream (blue box with red border). Step 3 - Identification of reads that map uniquely to the feature region. Step 4 - Definition of terminal exon boundaries (red box), given by a splice site at the 5’ end - inferred from split reads -, and the ‘intronic’ poly(A) site at the 3’ end. Classification of putative terminal exons is done with a Bayes classifier. Step 5 - The newly identified terminal exons are linked to upstream exons to which they were found to be spliced based on split reads, to generate novel isoforms. Step 6 - Prediction of protein coding regions in newly identified transcripts.

