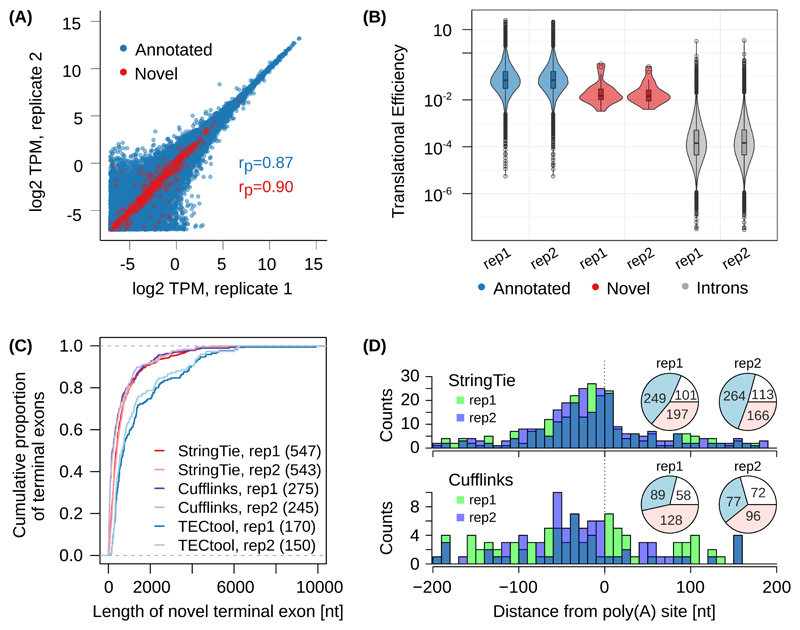
Figure 3. Evaluation of TECtool’s performance.
(A) Scatter plot of estimated expression levels of already annotated transcripts (ENSEMBL v87, transcript support level 1-5 (TSL1-5), blue, 168'726 transcripts) and of transcripts ending at TECtool-identified terminal exons (red, 842 novel transcripts), in biological replicates of RNA-seq from HEK 293 cells (rP indicate the corresponding Pearson correlations). (B) Translational efficiencies computed for annotated terminal exons, novel terminal exons and intronic regions (two-tailed t-test p-values for pairwise comparisons of regions based on TSL1-5, novel versus intron replicate 1 (rep1): 2.1e-16; replicate 2 (rep2): 5.4e-18, and annotated versus novel rep1: 1.4e-5; rep2: 8.6e-7). The numbers of annotated, novel and introns were in rep1: 16068, 24, and 64455, and in rep2: 15772, 25, and 63932. Boxes indicate the interquartile range (IQR) with the line corresponding to the median, whiskers correspond to the most extreme value that is within 1.5 times the IQR from the hinge and outliers beyond this range are shown as individual points. (C) Cumulative distribution of the length of novel terminal exons identified by TECtool, StringTie and Cufflinks in the two replicate RNA-seq data sets, relative to the TSL1-5 annotation. The number of novel terminal exons identified by each tool is indicated in parentheses. (D) Distance between experimentally determined PAS from the PolyAsite atlas 9 and the 3’ ends of novel transcripts identified by StringTie (top panel) and Cufflinks (bottom panel). Pie-charts show the number of 3’ ends of novel transcripts that have an experimentally determined PAS within +/-200 nts (blue), or have experimentally determined PAS farther away but in the same intron (red) or do not have any experimentally observed PAS in the respective intron (white).

