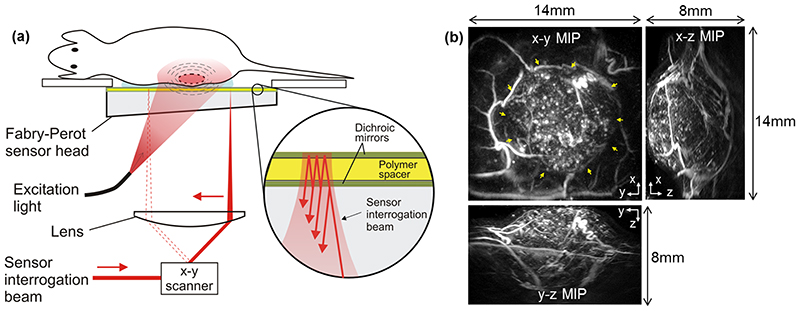
Figure 1. Fabry-Perot-based photoacoustic scanner and example image of a subcutaneous tumor xenograft.
(a) scanner architecture. Excitation laser pulses are transmitted through the FP sensor head and absorbed in the tissue generating photoacoustic signals which are then detected by the Fabry-Perot polymer film ultrasound sensor. Inset: an expanded view of the sensor which comprises a polymer spacer sandwiched between a pair of dichroic mirrors that are transparent to the excitation laser wavelength but highly reflective to the sensor interrogation beam wavelength. The sensor operates by raster scanning a focused continuous wave interrogation laser beam across it and measuring the change in the power of the reflected beam produced by acoustically-induced changes in the polymer spacer thickness. (b) Photoacoustic image of SW1222 tumor xenograft acquired using the scanner and displayed (clockwise) as x-y, x-z and y-z maximum intensity projections (MIPs). An animated volume rendered representation of this data can be viewed online (Video 1. The yellow arrows on the x-y MIP indicate the tumor. The x-z and y-z MIPs show that the entire tumor can be visualised with high resolution to a depth of approximately 8mm.

