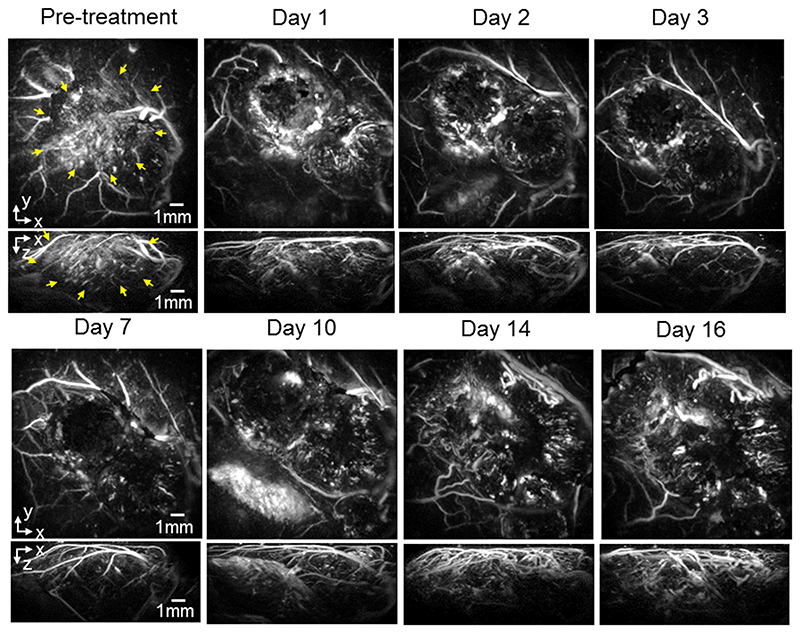
Figure 5.
Photoacoustic images displayed as maximum intensity projections (MIPs) showing the longitudinal response of a second LS174T tumor (mouse m2LS) to 40mg/kg IV dose of OXi4503 over 16 days. The horizontal x-y maximum intensity projections (MIP) are for z = 1 - 6 mm. After treatment, the loss of signal contrast in the tumor region (indicated with yellow arrows in the pre-treatment images) is still significant even at Day 16

