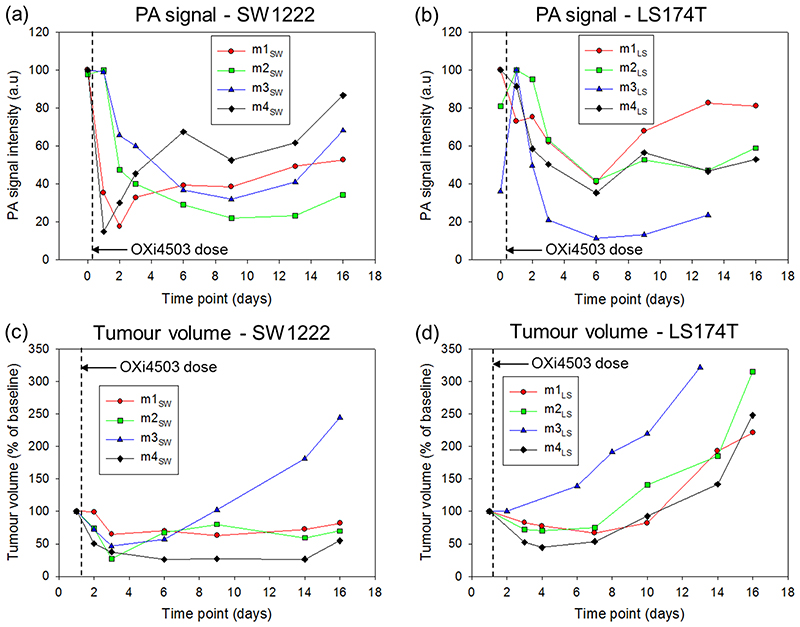
Figure 6.
Photoacoustic (PA) signal intensity and tumor volume of the two tumor types treated with 40mg/kg of OXi4503. Photoacoustic signal at different time points for (a) SW1222 and (b) LS174T tumors. Tumor volume measured by callipers at corresponding time points for (c) SW1222 and (d) LS174T tumors. For both tumor types, the PA signal intensity reduces after treatment before increasing again almost to pre-baseline levels. This is in agreement with the post-treatment destruction of the tumor core and subsequent repopulation of the vasculature, as shown in the PA images Figure 2–5. The tumor volumes in the SW1222 predominantly show an arrest in the tumor growth after treatment, up to day 16. In the LS174 tumors, an initial reduction in volume after treatment is followed by an increase at the later time points. SW1222: the PA signal data for mice m4SW and m3SW was obtained from the images shown in figures 2 and 3 respectively. LS174T: the PA signal data for mice m4LS and m2LS was obtained from the images shown in figures 4 and 5 respectively

