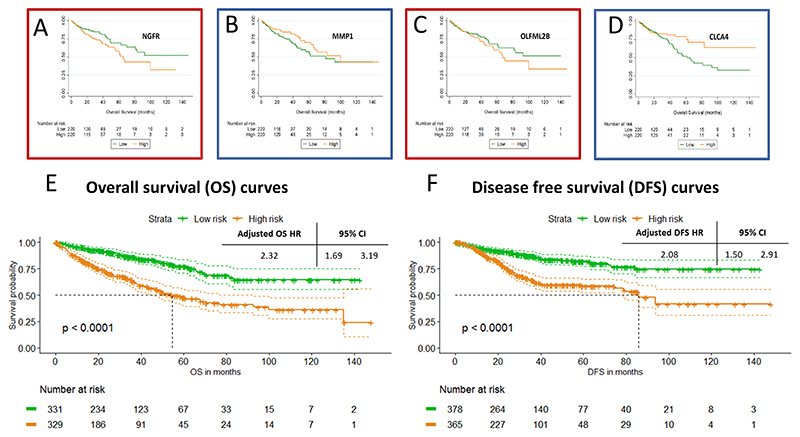
Figure 6. Survival curves for single genes and 20-gene signature.
Panels A, B, C and D show Kaplan Meier curves for OS for the genes NGFR (p=0.021), MMP1 (p=0.06), OLFML2B (p=0.281) and CLCA4 (p=0.043) respectively. P-values are obtained by log-rank test. E and F show Kaplan Meier curves for the overall 20-gene signature for pooled overall survival (n=660) and disease-free survival (n=743), respectively. Hazard ratios displayed are related to the multivariate analysis of the pool analysis adjusted by age, gender and stage.

