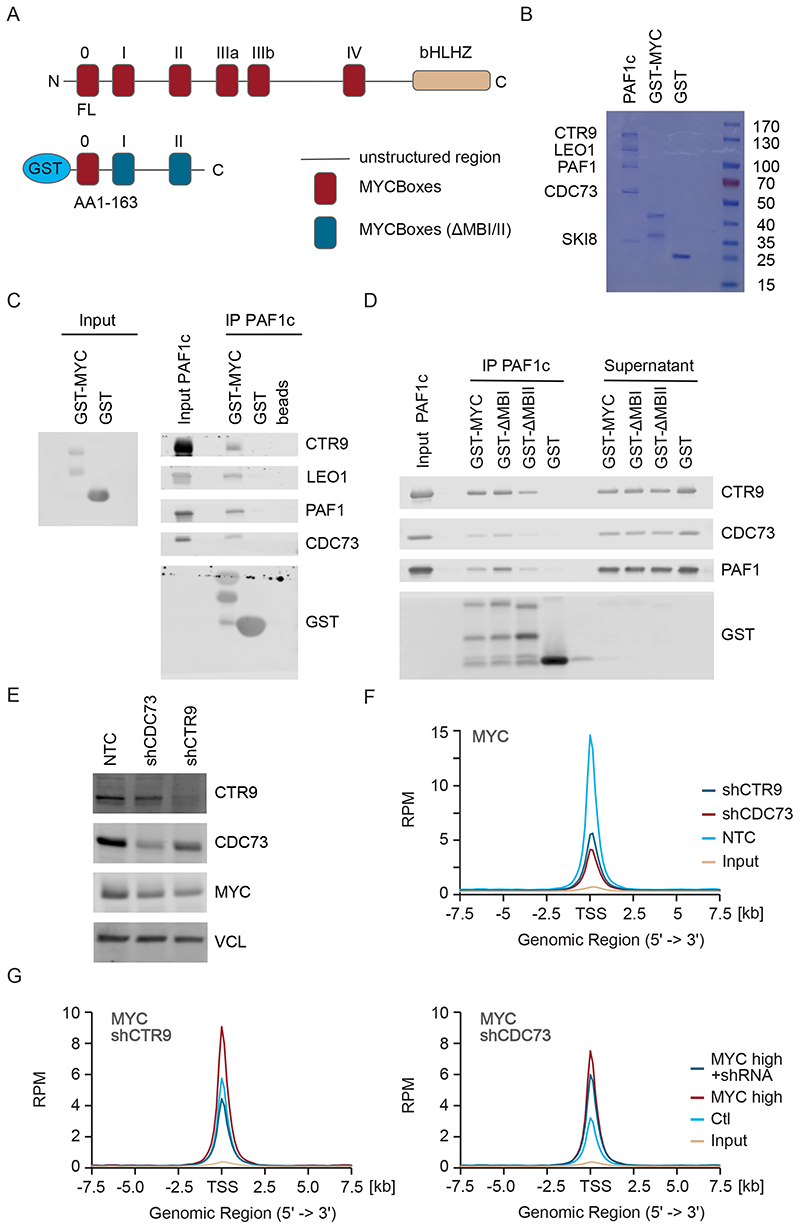
Figure 1. Binding of PAF1c to MYC enhances association of MYC with active promoters.
A. Diagram of MYC protein structure showing the position of MYCBoxes and the GST-MYC construct used for pulldown experiments.
B. Coomassie gel showing purified proteins. 10% of input material is shown.
C. Immunoblots of MYC and PAF1c (n=3; in all legends, n indicates the number of independent biological replicates).
D. Immunoblots of pulldown experiment using GST-△MYCBox I and GST-△MYCBox II constructs (n=3).
E. Immunoblot showing levels of CTR9, CDC73 and MYC in U2OS cells after stable expression of constitutive shRNAs. Vinculin (VCL) was used as loading control (n=3).
F. Density plot of MYC centered on the transcription start site (TSS) of 8,437 active promoters in a ChIP-Rx experiment in control U2OS cells or in cells expressing shCTR9 or shCDC73 (n=1). All ChIP-Seq traces show S.E.M. as a shade.
G. Density plot of MYC as in (F) in a ChIP experiment in control U2OS cells or in cells stably expressing MYC and Dox inducible shRNA targeting CTR9 (shCTR9) or shCDC73. (n=1). See also Figure S1.

