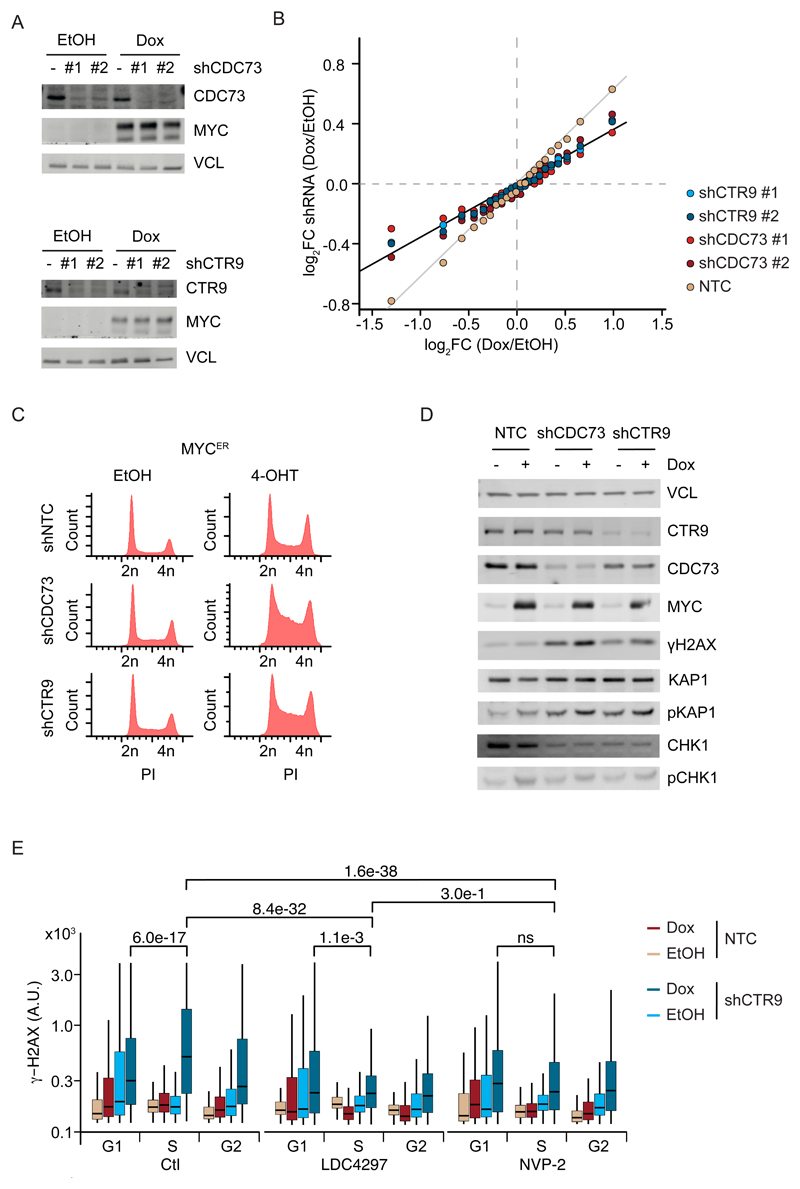
Figure 6. MYC induces rampant DNA damage in the absence of PAF1c.
A. Immunoblot of MYC in U2OS cells expressing Dox inducible MYC and non-targeting shRNA, shCDC73 (top) or shCTR9 (bottom) (n=4).
B. Summary of RNA sequencing experiments from the cells described in (A). Genes were sorted in 23 bins (see STAR methods). The plot shows the change in gene expression observed for each bin upon expression of the indicated shRNAs. Values are average of four biological replicates using two different shRNAs each for CTR9 and CDC73.
C. FACS-profile of propidium-iodide stained U2OS-MYCER cells expressing shCTR9 or shCDC73 upon addition of 4-OHT (200 nM) for 24 h (n=2).
D. Immunoblot of U2OS cells expressing Dox inducible MYC and non-targeting shRNA or shCDC73 or shCTR9 (n=3).
E. Quantitative immunofluorescence of γ-H2AX in U2OS control cells (n=3) or cells treated with the CDK7 inhibitor LCD4297 or the CDK9 inhibitor NVP-2 for 3h. Cells were stratified for their cell cycle position by Hoechst staining. Shown is the mean intensity of γ-H2AX for at least 800 cells. See also Figure S6.

