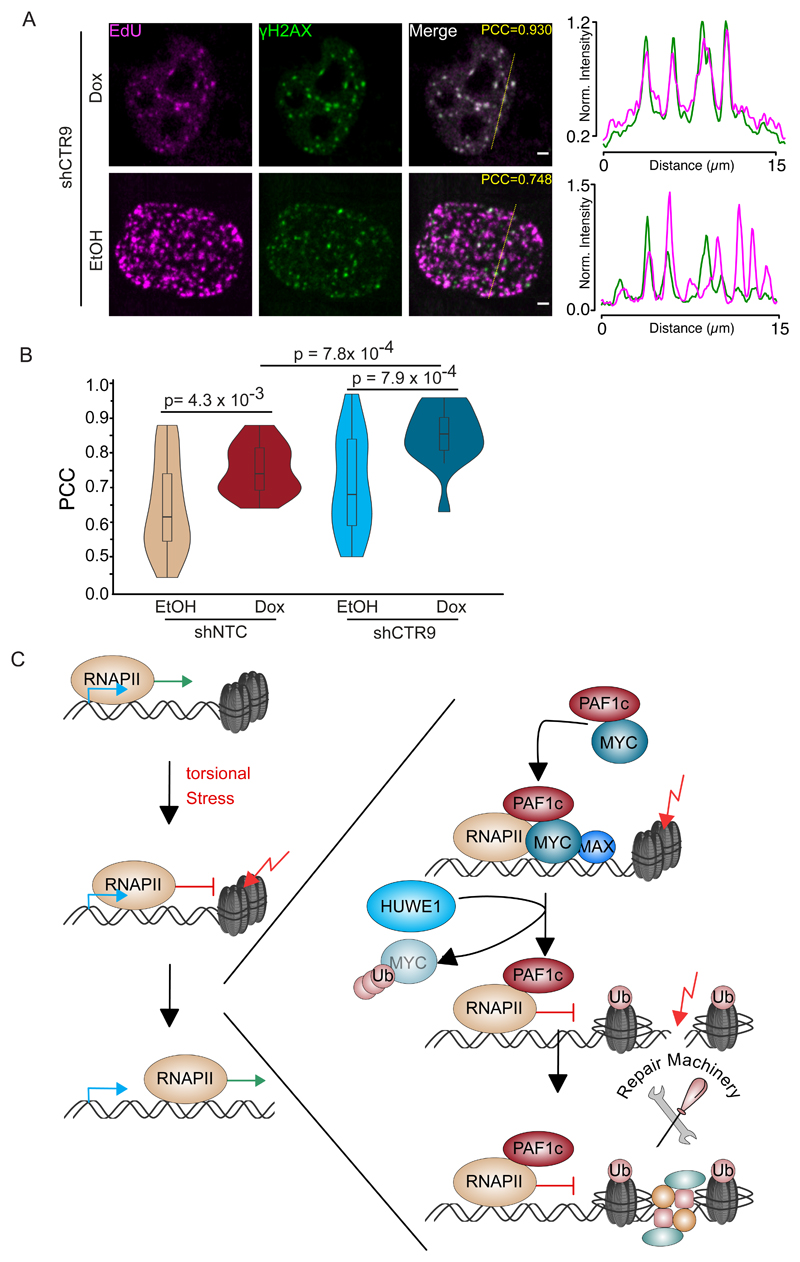
Figure 7. Repair-associated DNA synthesis upon PAF1 depletion.
A. Confocal images of U2OS cells showing EdU incorporation immediately adjacent to γ-H2AX foci in U2OS cells upon constitutive expression shCTR9 and induction of MYC for 24 h. Insert shows Pearson´s correlation constant (“PCC”). Scale bars represent 2 μm.
B. Violin Plot of Pearson correlation coefficients for co-localization of DNA synthesis and γ-H2AX for each of the experimental conditions (n=17-21 cells).
C. Model of our findings. See also Figure S7.

