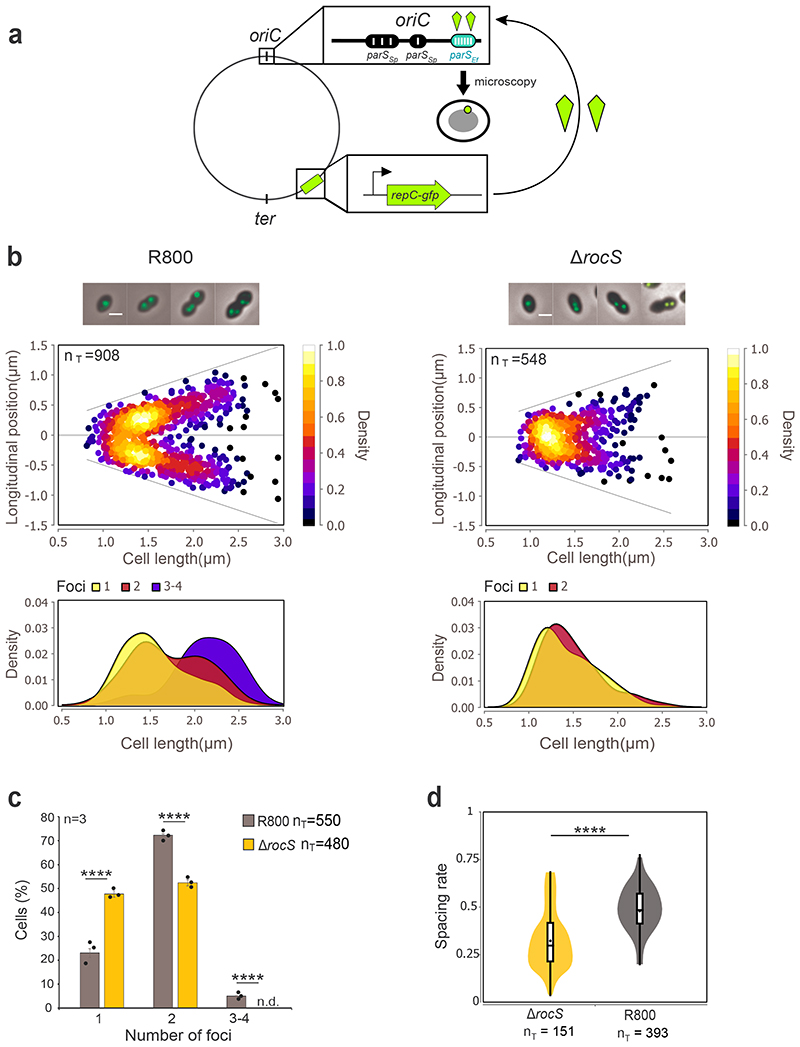
Figure 2. oriC segregation patterns in wild-type and ΔrocS cells.
a. Schematic representation of the Par system used to image the origin of replication (oriC). parS sequences from E. faecalis (parS Ef, blue oval) were inserted into the chromosome near the pneumococcal oriC while the parB homolog repC fused to gfp (RepC-GFP, green kite) is expressed ectopically under the control of the PcomX promoter. Upon loading of RepC-GFP onto parS Ef sites, the localization of oriC is followed by fluorescence microscopy (green dot). parS Sp indicates native pneumococcal parS sites. b. (upper panels) Localization heat maps of oriC (RepC-GFP) positions along the cell length in wild-type and ΔrocS R800 cells. Representative merged images between phase contrast and GFP fluorescence signal of cells with either 1, 2 or 3/4 foci are shown on the top. Scale bar, 1 μm. (lower panels) Kernel density plots of the cell length in relation to the number of foci in wild-type and ΔrocS R800 cells. c. Relative percentages of cells as a function of the number of oriC foci in WT (grey) and ΔrocS (orange) cells. Bar chart, with data points overlap, represents the mean ± SEM. Two-tailed P-values derived from a two-population proportion test for the following pairs of proportions: ‘R800-WT’ vs ‘R800-ΔrocS’ one foci (P<0.0001), two foci (P= 8.9.10-16), three foci (P=1,5.10-10). d. Measurements of the spacing rate (relative distance between 2 foci of oriC in relation to the cell length). Box indicates the 25th to 75th percentile and Whiskers indicate the minimum and the maximum. The mean and the median are indicated with a dot and a line in the box, respectively. Two-tailed P-value derived from a Mann-Whitney test between ‘R800-WT’ and ‘R800-ΔrocS’ is P = 7.9.10-9. **** P < 0.0001. nT indicates the number of cells analyzed. Experiments were performed in triplicate.

