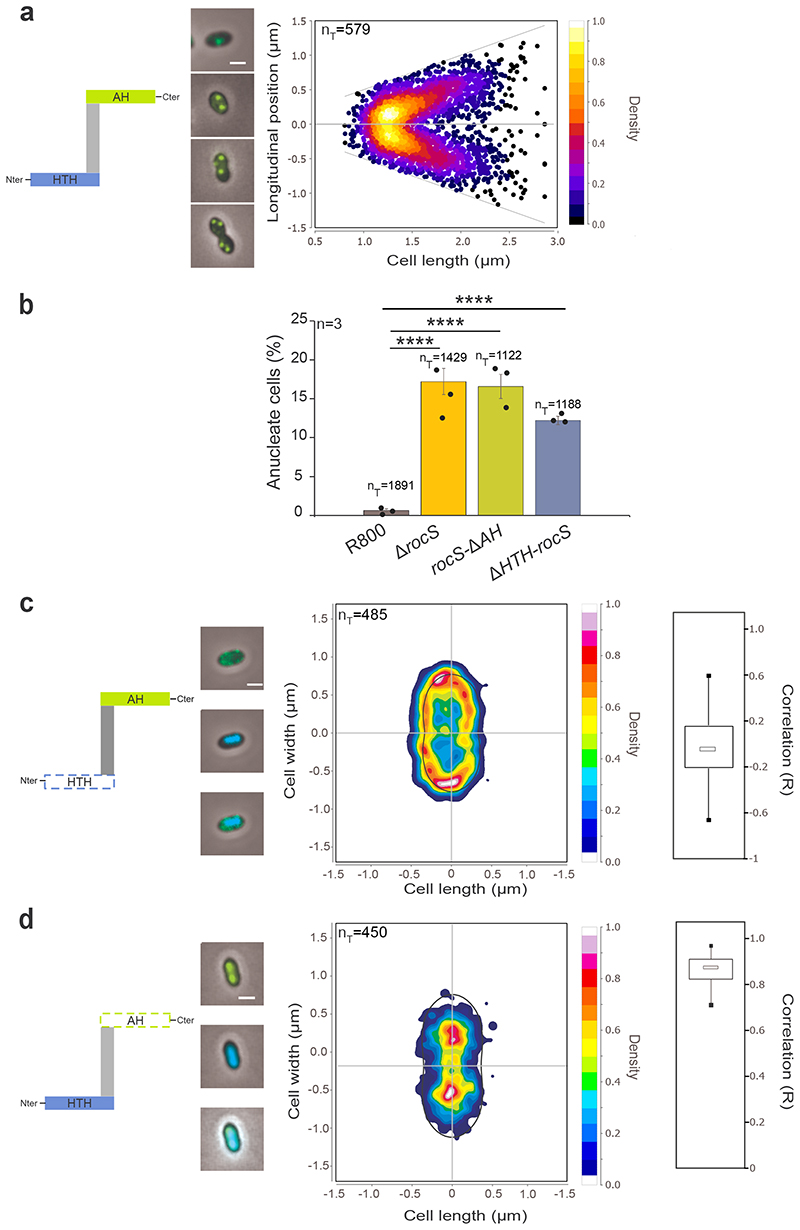
Figure 3. Localization of GFP-RocS and derivatives and impact on nucleoid localization.
Schematic representations of RocS and derivatives are shown on the left of panels a, c and d. a. Heat map representing the longitudinal localization of GFP-RocS as a function of the cell length in R800 cells. Representative merged images of cells with either 1, 2 or 3/4 foci are shown on the left. b. Relative percentage of anucleate cells for rocS-ΔAH and ΔHTH-rocS R800 strains. Bar chart, with data points overlap, represents the mean ± SEM. nT indicates the total number of cells analyzed from three independent experiments. Two-tailed P-values derived from a two-population proportion test for the following pairs of proportions: ‘R800-WT’ vs ‘R800-ΔrocS’ (P<0.0001), ‘R800-WT’ vs ‘R800-rocS-ΔAH’ (P<0.0001) and ‘R800-WT’ vs ‘R800-ΔHTH-rocS’ (P<0.0001). **** P<0.0001. c-d. Heat maps representing the 2-dimensional localization patterns of GFP-ΔHTH-RocS (c) and GFP-RocS-ΔAH (d) in R800 cells. Representative overlays of phase contrasts and, GFP or DAPI fluorescence signals, or both signals, are shown on the left. Scale bar, 1 μm. The distribution of the Pearson correlation coefficient (R), measured between the DAPI and GFP signals for each strain are shown as box (25th to 75th percentile) and whisker (minimum and maximum) plots on the right.

