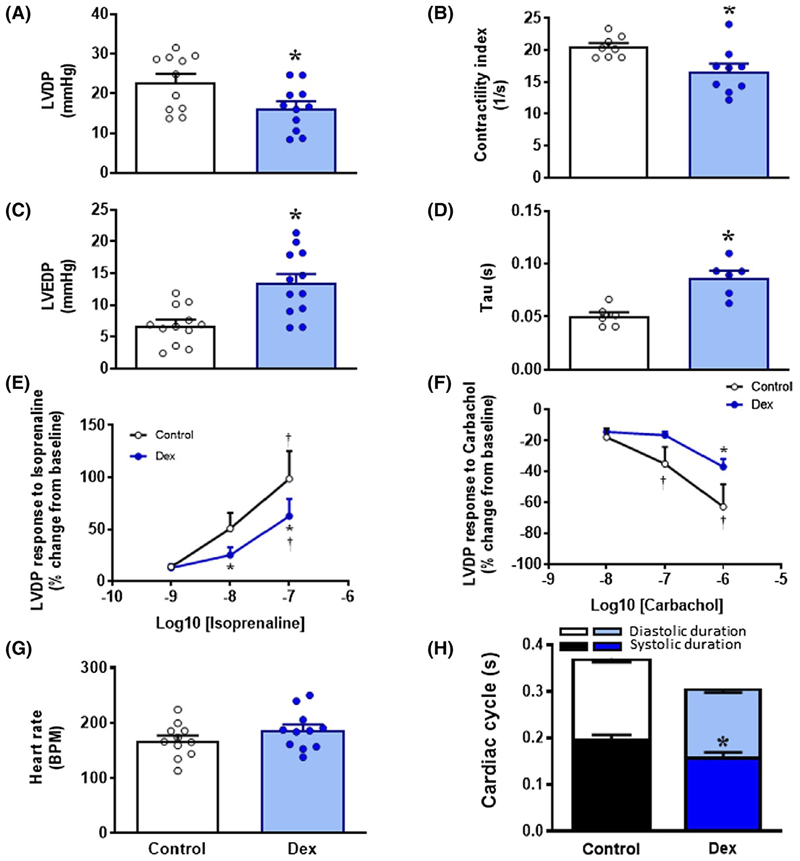
Figure 2. Cardiac function at 19 days of incubation.
Data are mean ± SEM for A, Left ventricular developed pressure (LVDP), B, Contractility index, C, Left ventricular end diastolic pressure (LVEDP, D, Left ventricular relaxation time constant (Tau), E & F, Left ventricular inotropic responses to Isoprenaline and Carbachol (E and F; n = 9 controls; n = 8 dexamethasone), G, Heart rate (n = 11 controls; n = 11 dexamethasone), H, Cardiac cycle duration (n = 12 controls; n = 12 dexamethasone). Significant difference *P < .05 vs control, † vs lowest dose. Student’s t test for unpaired data for A-F, two-way RM ANOVA with Tukey test for E and F

