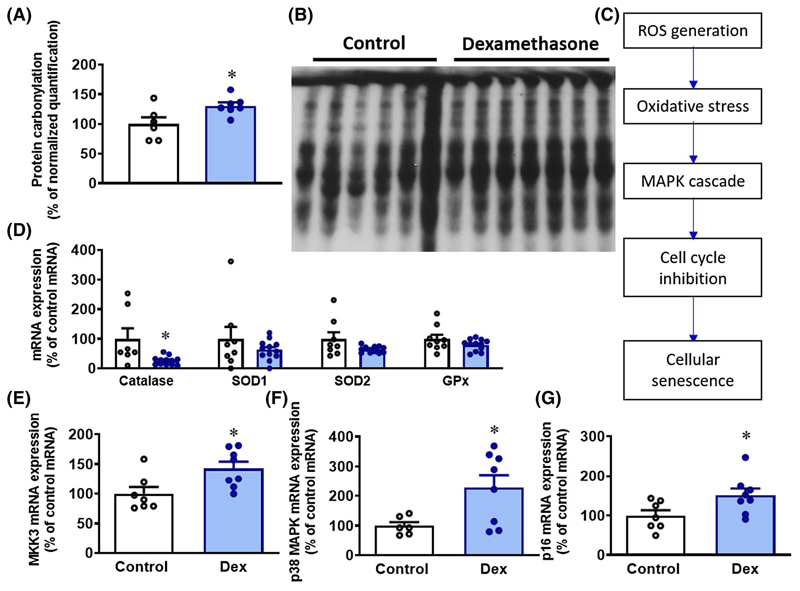
Figure 5. Reactive oxygen species and senescence pathways.
Data are mean ± SEM. A, Protein carbonylation as compared to control samples. B, OxyBlot bands for quantification of protein carbonylation. Sample 6 was within the 2SD margin, and therefore, not excluded from the control group. C, Illustration of ROS mediated cell senescence pathway. D, mRNA expression of antioxidants Catalase, Super Oxide Dismutase 1 (SOD1), Super Oxide Dismutase 2 (SOD2), and Glutathione peroxidase (GPx), E, mRNA expression of MKK3 (also known as MAPKK3), F, mRNA expression of p38-MAPK, G, mRNA expression of p16. Significant difference *P < .05 vs control. Student’s t test for unpaired data

