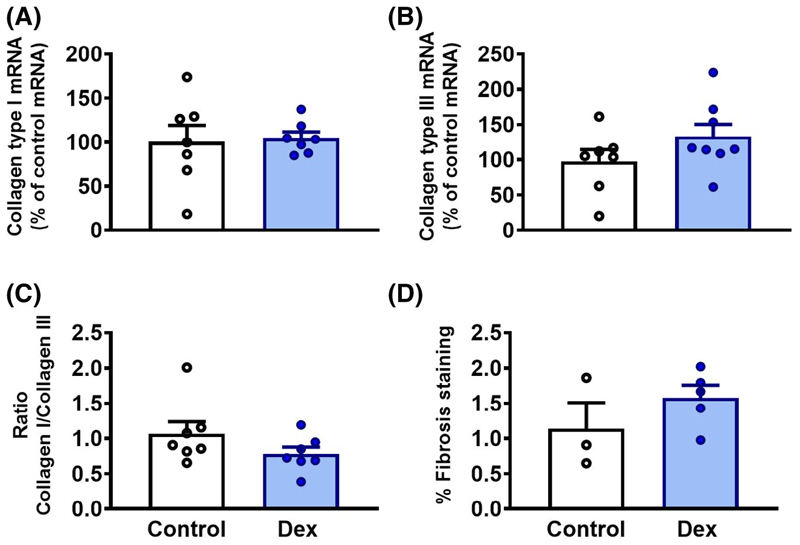
Figure 6. Cardiac fibrosis.
Data are mean ± SEM. A, mRNA expression of collagen type I. B, mRNA expression of collagen type II. C, Ratio between mRNA expression of collagen type I and mRNA expression of collagen type III. D, Cardiac fibrosis staining with picrosirius red, expressed as a percentage of fibrotic tissue. There were no significant differences

