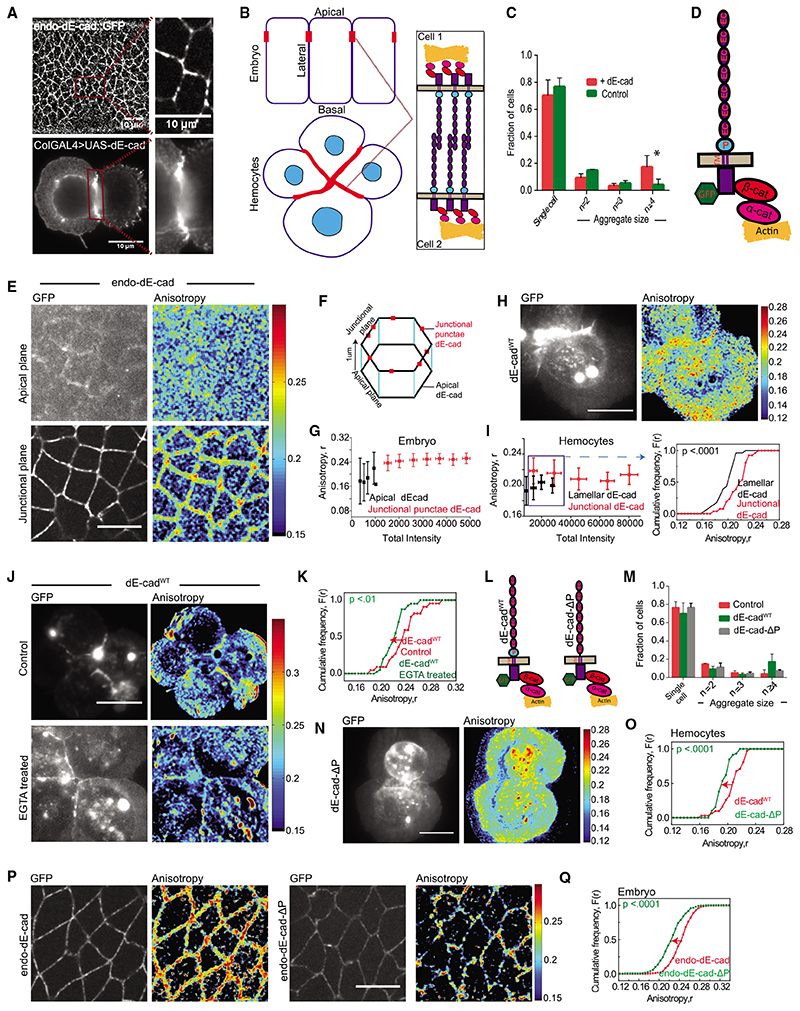
Figure 1. Nanoscale organization of dE-cad in embryo and larval hemocytes probed by homo-FRET microscopy.
(A) Confocal images of dE-cad::GFP-expressing epithelial cells in an early developing embryo (left top) and dE-cad labeled using monoclonal DCAD2 in hemocytes from wandering third-instar larvae from dE-cadWT-expressing flies (left bottom); insets show magnified view of dE-cad in embryos (right top) and hemocytes (right bottom).
(B) Schematic showing Drosophila embryo epithelial cells and larval hemocytes forming cell-cell junctions with a zoomed view of the trans interactions of dE-cad at the junctions.
(C) Histogram showing the percentage of cells as single cells and cell aggregates in control and dE-cadWT::GFP-expressing hemocytes. Dataset contains normalized cell number from 5 control larvae and 6 dE-cadWT larvae, and the bar represents the mean and the standard deviation in each condition.
(D) Schematic showing Drosophila E-cadherin and its interaction machinery.
(E) Total intensity and EA images of endo-dE-cadWT::GFP in the apical and junctional plane in the early gastrulation stage of the embryo.
(F) Representation of epithelial cells of the embryo showing the confocal planes at which apical and junctional EA measurements are taken.
(G) Intensity versus EA plots of endo-dE-cad in the apical and junctional plane from similar stage embryos (n = 5).
(H and I) Total intensity and anisotropy images (H) of dE-cadWT::GFP-expressing hemocytes from wandering third-instar Drosophila larvae, scatterplot (I; left graph) of intensity versus EA values and cumulative frequency distribution of EA values (I; right graph) of lamellar, and junctional dE-cadWT of similar intensity range in the scatterplot (boxed area). Smooth lines indicate data obtained from the lamellar localized proteins, whereas line with square symbols indicates junctional localization.
(J and K)Total intensity and EA images(J) and cumulative frequency distributions of EA values (K) of junctional dE-cadWT::GFP of similar intensity ranges in control and EGTA-treated conditions.
(L) Schematic of dE-cadWT::GFP and dE-cad-ΔP::GFP proteins.
(M) Histogram showing the percentage of cells as single cells and cell aggregates in control and dE-cadWT::GFP- and dE-cad-ΔP::GFP-expressing hemocytes. Dataset contains normalized cell number from 5 control larvae, 6 dE-cadWT larvae, and 4 dE-cad-DP larvae, and the bar represents the mean and the standard deviation in each condition.
(N and O) Total intensity and EA images (N) and cumulative frequency distributions (O) of junctional EA values of dE-cadWT- and dE-cad-DP-expressing hemocytes.
(P and Q) Total intensity and EA images (P) and cumulative frequency distributions of EA values (Q) of junctional dE-cad obtained from endo-dE-cad::GFP- and endo-dE-cad-ΔP::GFP-expressing embryos as indicated where 5 embryos each were analyzed for endo-dE-cad endo-dE-cad-DP-expressing animals. Error bars depict standard deviation.
p values are calculated using Mann-Whitney U test. ns (not significant), p > 0.05; *p < 0.05; **p < 0.01; ***p < 0.001. Scale bars, 10 μm. Sample size is provided in Table S1. See also Figure S1.

