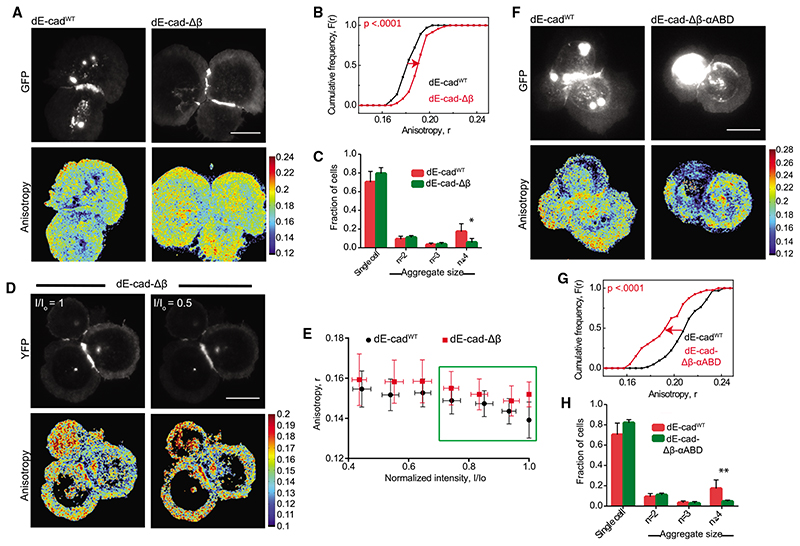
Figure 3. Adaptor protein-dependent clustering of junctional dE-cad.
(A and B) Total intensity and EA images (A) of dE-cadWT::GFP- and dE-cad-Db::GFP-expressing hemocytes and corresponding cumulative frequency distributions (B) of EA values of junctional dE-cad.
(C) Histogram showing percentage of cell aggregates in dE-cadWT::GFP- and dE-cad-Db::GFP-expressing cells. Data points show average normalized cell number from 6 dE-cadWT larvae and 7 dE-cad-Db larvae. Error bar represents the standard deviation in each condition.
(D and E) Total intensity and EA images (D) of dE-cadWT::YFP- and dE-cad-Δβ::YFP-expressing cells at the beginning of photo bleaching and at 50% photobleaching and corresponding normalized intensity versus EA plots (E) of junctional dE-cad obtained upon photobleaching. Each data point represents average EA values taken from multiple regions of different junctions (n = 5 [dE-cadWT and 4 [dE-cad-Δβ]). Error bars show standard deviation for the corresponding intensity bins normalized to the starting intensity value.
(F and G) Total intensity and EA images (F) of dE-cadWT::GFP- and dE-cad-Δβ-αABD::GFP-expressing hemocytes and corresponding cumulative frequency distributions (G) of EA values.
(H) Histogram showing percentage of cell aggregates in dE-cadWT::GFP- and dE-cad-Δβ-αABD::GFP-expressing cells. Dataset contains average normalized cell number from 6 dE-cadWT larvae and 5 dE-cad-Δβ-αABD larvae. Error bar represents the mean and the standard deviation in each condition.
p values are calculated using Mann-Whitney U test. Scale bars, 10 μm. Sample size is provided in Table S1. See also Figure S3.

