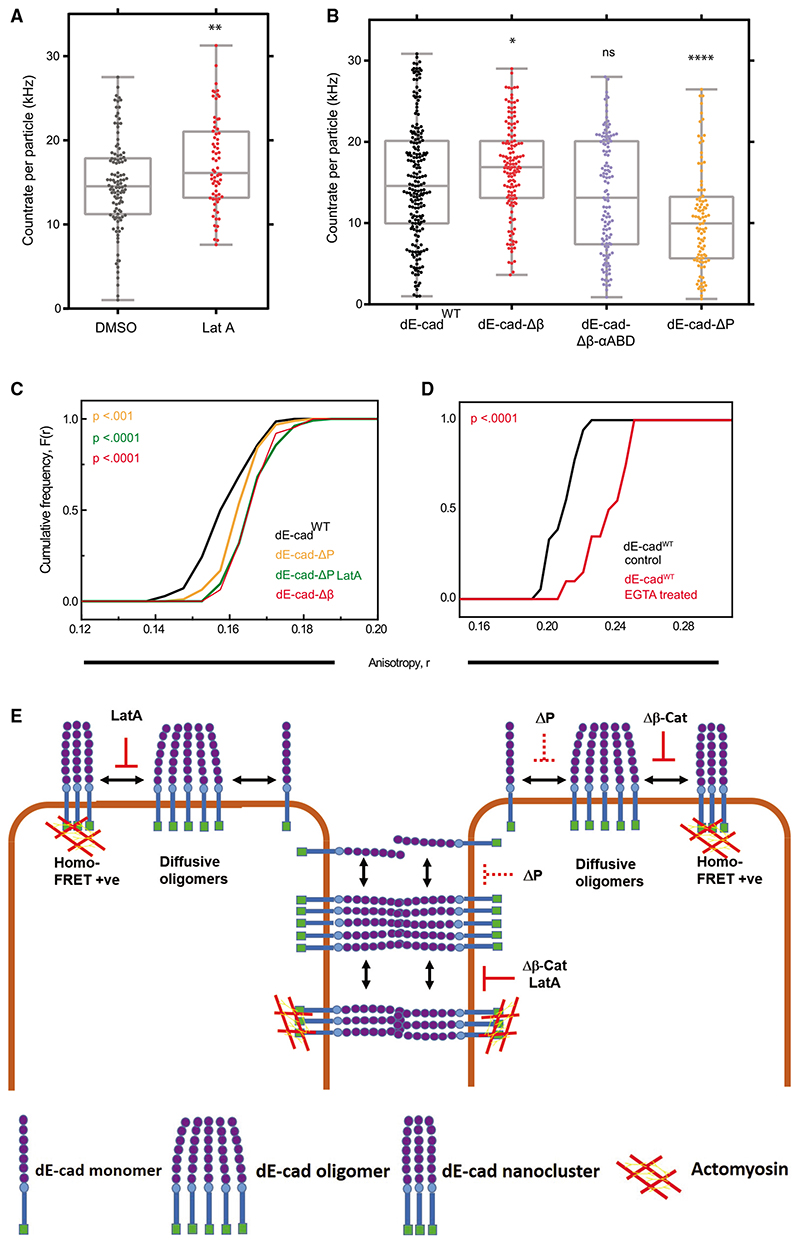
Figure 4. Analysis of E-cadherin oligomerization.
(A) Brightness distribution of dE-cadWT oligomers in the lamella of dE-cadWT::GFP-expressing cells treated with DMSO or Lat A. Parameters, such as the number of diffusing species and diffusion timescales estimated through related FCS analysis, are detailed in Figure S4 and Data S2.
(B) Brightness distribution of oligomers of various GFP-tagged constructs of dE-cad in the lamella of cells expressing these constructs. Parameters, such as the number of diffusing species and diffusion timescales estimated via related FCS analysis, are detailed in Figure S4 and Data S3.
(C) Cumulative frequency distributions of EA values of lamellar dE-cad in dE-cadWT-, dE-cad-ΔP-, and dE-cad-Δβ-expressing hemocytes.
(D) Cumulative frequency distributions of EA values of lamellar dE-cadWT::GFP of similar intensity range in control and EGTA-treated conditions.
(E) Schematic model for the formation of cis oligomers and actomyosin-sensitive nanoscale clusters of dE-cad at the lamellar membrane or trans oligomers and nanoclusters at cell-cell junctions under different conditions. Solid red line indicates complete loss, and dashed red line indicates partial loss of nanoclustering or oligomerization.
p values are calculated using Mann-Whitney U test. ns, p > 0.05; *p < 0.05; **p < 0.01; ***p < 0.001; ****p < 0.0001. Sample size is provided in Table S1. See also Figure S4 and Data S1, S2, and S3.

