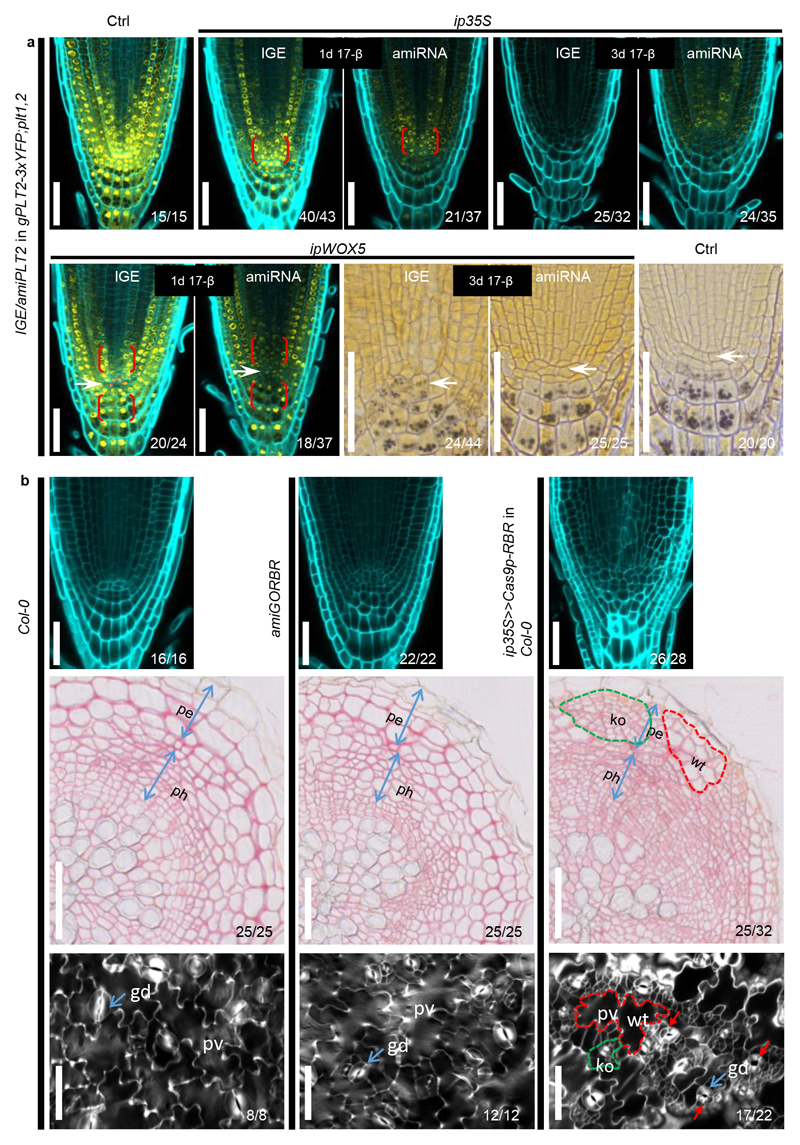
Extended Data Figure 10. Comparison of IGE system with inducible amiRNA.
(a) IGE-PLT2 displays more specific and stronger PLT2-3xYFP downregulation than amiPLT2. After a one-day induction, ip35S>>amiPLT2-1 in gPLT2-3xYFP; plt1,2 and ipWOX5>>amiPLT2-1 in gPLT2-3xYFP; plt1,2 showed a broader reduction of the YFP signal, particularly in the bracketed regions where no inducible promoter activity was found. Conversely, induced PLT2 editing caused very local loss of the YFP signal. After a three-day induction, the YFP signal is still visible in most of ip35S>>amiPLT2-1 in gPLT2-3xYFP; plt1,2 transformants but not in ip35S>>Cas9p-PLT2 in gPLT2-3xYFP; plt1,2 transformants. There was no QC differentiation in ipWOX5>>amiPLT2-1 in gPLT2-3xYFP; plt1,2 roots. Ctrl refers to 7-day (top panel) or 9-day (bottom panel) old gPLT2-3xYFP; plt1,2. White arrows mark the QC. (b) Comparison of the RM (top panel), root secondary growth (middle panel) and cotyledon epidermis (bottom panel) of Col-0, 35S:amiGORBR and ip35S>>Cas9p-RBR in Col-0. Inducing RBR editing (germination on 17-β plates for 6 days (top panel), 20 days (middle panel) and 6 days (bottom panel)) resulted in more excessive cell divisions in the LRC than was seen in amiGORBR roots (top panel, germination and six days of growth on 17-β-free plates). Furthermore, RBR editing caused cell overproliferation in phloem (ph) cells and the periderm (pe) of root secondary tissues (middle panel) and pavement cells (pv) and guard cells (gd, blue arrows) of cotyledon epidermis (bottom panel), which was not observed in amiGORBR roots and cotyledons. The knockout (ko) sectors (green dotted line) were frequently accompanied by WT sectors (red dotted line), which can be regarded as an internal control. Red arrows mark guard cells divisions. Cell walls are marked by calcofluor. Numbers indicate the frequency of observed phenotype in independent samples analyzed. Experiments were repeated three times, except experiment on cotyledon epidermis phenotyping, which was repeated two times. Scale bars, 50 μm.

