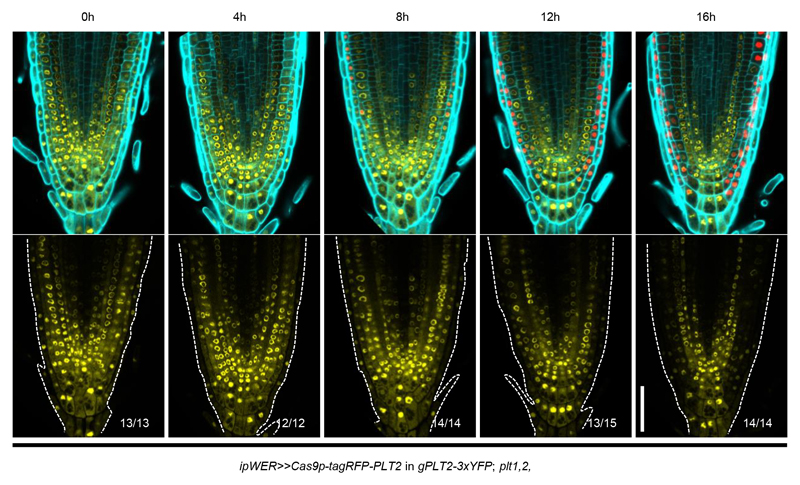
Extended Data Figure 2. IGE system enables real time observation of genome editing.
To monitor PLT2 editing dynamics, a time-course 17-β induction was conducted to ipWER>>Cas9p-tagRFP-PLT2 in gPLT2-3xYFP; plt1,2 (T2 generation, line #1). Cas9p-tagRFP fluorescence appeared after 4 hours of induction, followed by gradual reduction of PLT2-3xYFP expression (starting after 12 hours of induction). Cas9p-tagRFP expression and editing activity was gradually spread inwards, likely due to the radial diffusion of 17-β within ipWER domain. White dotted lines mark the RM outlines. Cell walls are visualized by calcofluor. Experiments were repeated three times. Numbers indicate the frequency of observed phenotype within given induction duration. Scale bar, 50 μm.

