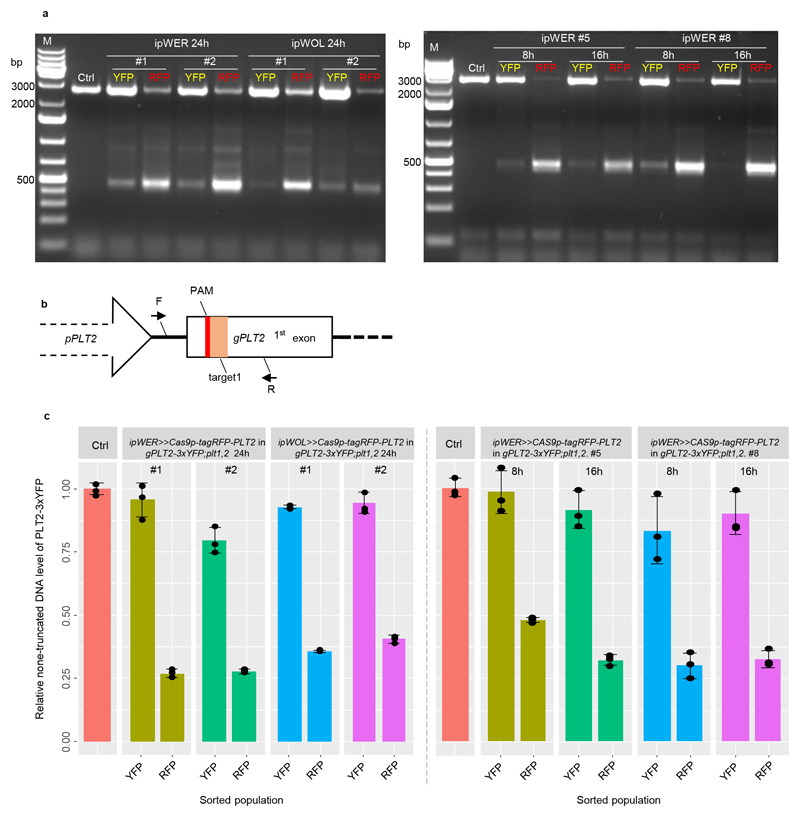
Extended Data Figure 3. Detection and quantification of PLT2 deletion from sorted cell populations.
(a) PCR-based detection of PLT2 deletion in sorted cell populations. While several truncated bands were visible, the predominant truncated band corresponds to the large fragment deletion between target1 and target4 (see location of target sites in Supplementary Fig. 1). Experiments were repeated three times. (b) qPCR primer design strategy for PLT2 deletion efficiency quantification. To avoid amplification of native PLT2, forward primer (F) was designed at attB1 site linking promoter and genomic PLT2 and reverse primer (R) was designed at downstream of target1. (c) Quantification of PLT2 deletion efficiency by qPCR with the pooled genome DNA from the sorted population (n>600) as template. Error bars represent s.d., and experiments were repeated three times with similar results. Individual values (black dots) and means (bars) are shown. Ctrl indicates the gPLT2-3xYFP;plt1,2.

