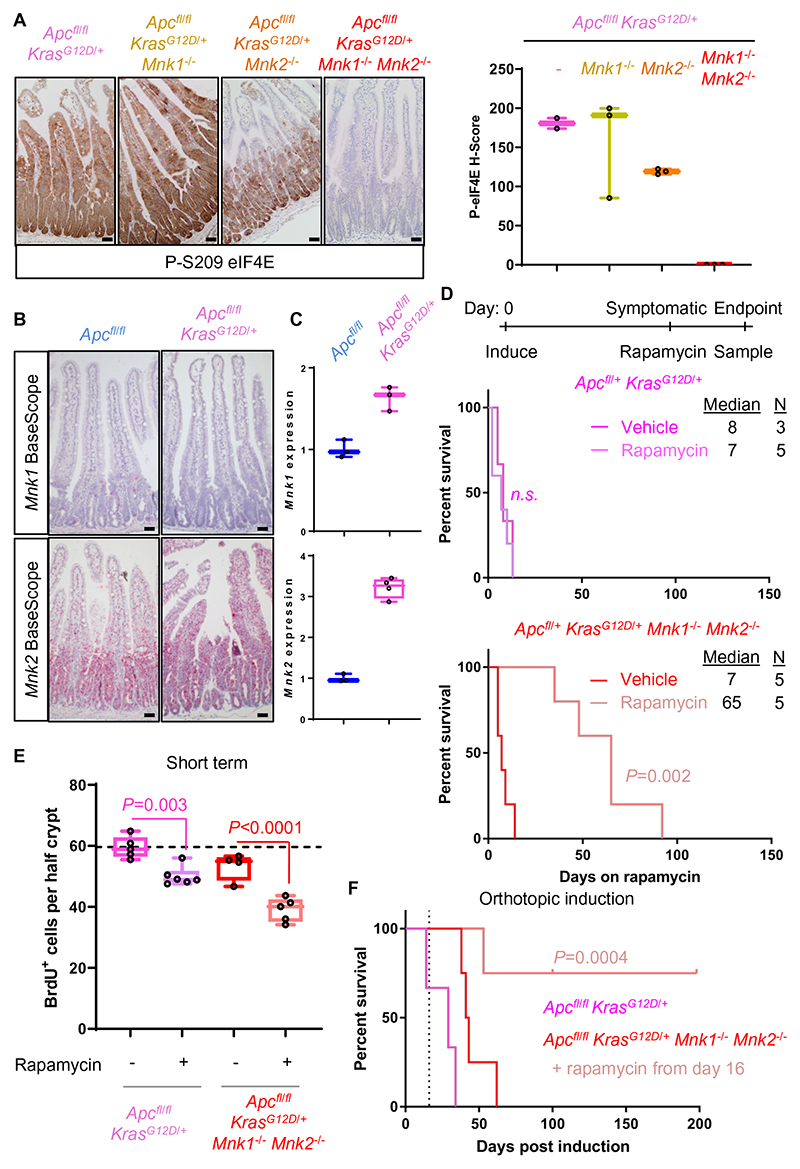
Figure 4. Mnk deletion suppresses mutant KRAS-driven tumor proliferation in combination with rapamycin treatment.
(A) IHC for P-eIF4E in the small intestine of Apcfl/fl KrasG12D/+ short-term model mice with deletion of Mnk1, Mnk2 or both Mnk1 and Mnk2. Right, quantification of this P-eIF4E staining. (B) BaseScope analysis of Mnk1 and Mnk2 expression in Apcfl/fl and Apcfl/fl KrasG12D/+ small intestines. (C) qPCR for Mnk1 and Mnk2 in Apcfl/fl and Apcfl/fl KrasG12D/+ small intestines. Levels are expressed relative to Actb mRNA expression. (D) Top, schematic of treatment timeline. Apcfl/+ KrasG12D/+ and Apcfl/+ KrasG12D/+ Mnk1-/- Mnk2-/- tumor model mice were aged until symptoms of intestinal tumors, and then treated with rapamycin or vehicle until endpoint. Survival is plotted as the number of days on rapamycin or vehicle treatment. P value is from a Log-rank Mantel-Cox test. (E) BrdU incorporation scored from small intestines of Apcfl/fl KrasG12D/+ and Apcfl/fl KrasG12D/+ Mnk1-/- Mnk2-/- short-term model mice, treated with and without rapamycin. Apcfl/fl KrasG12D/+ data are reproduced from Figure 1A, for ease of comparison. ≥25 half crypts were quantified per mouse, with the average for each mouse plotted in the figure shown. P values are from one-way ANOVA Tukey’s multiple comparisons tests. Horizontal line represents the average for Apcfl/fl KrasG12D/+ mice. (F) Survival plot following orthotopic induction in the distal colon of Apcfl/fl KrasG12D/+ (n=3) or Apcfl/fl KrasG12D/+ Mnk1-/- Mnk2-/- mice (n=4). A cohort of Apcfl/fl KrasG12D/+ Mnk1-/- Mnk2-/- mice was also treated with rapamycin from day 16 (n=4), indicated by vertical dashed line. Colonic polyps were imaged by colonoscopy on the days shown. P value is from a Log-rank Mantel-Cox test. An Apcfl/fl KrasG12D/+ Mnk1-/- Mnk2-/- mouse on rapamycin was censored at 100days post induction not related to procedure and two were censored at the end of study at 202days post induction. All data are represented as mean ± S.E.M. Scale bars, 50μm. See also Figure S4.

