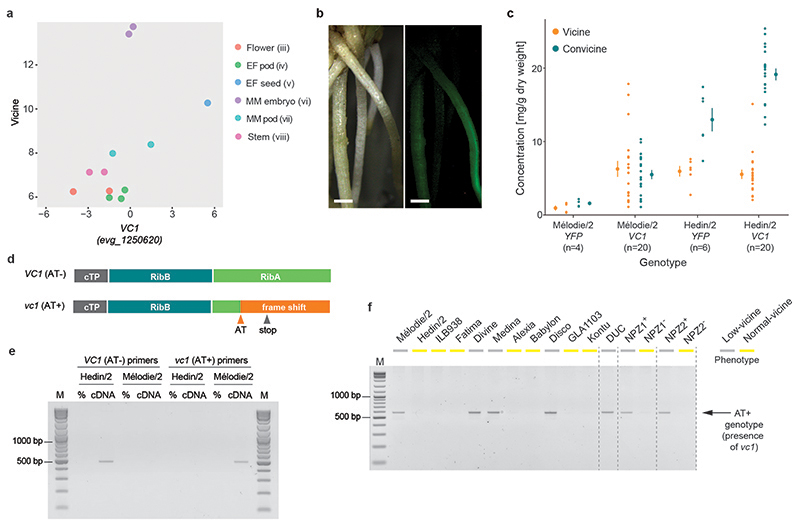
Fig. 3. Characterization of VC1 as the vc- gene.
(a) Correlation between the logarithms of vicine content (metabolic feature 89) and VC1 transcript abundance across Hedin/2 tissues as shown by the initial gene expression analysis and metabolite profiling. (b) Hairy roots of faba bean transformed with YFP under the control of the pLjUbi promoter. Pictures taken under white light (left) and UV light (right) are shown. The scale bar corresponds to 1 mm. (c) Vicine and convicine content in hairy roots transformed with YFP (control) or VC1 under the control of the pLjUbi promoter in the background of either Mélodie/2 (low-vicine) or Hedin/2 (normal-vicine) lines. Individual data points represent biological replicates, with the number of replicates (n) indicated under each genotype label. For each tissue, the mean ± SEM is presented as the measure of center. (d) Predicted functional domains of VC1 and the effect of the AT dinucleotide insertion (AT) in vc1. cTP, chloroplast transit peptide; RibB, 3,4-dihydroxy-2-butanone-4-phosphate synthase domain, RibA, GTP cyclohydrolase II domain. (e) Selective PCR amplification of VC1 from Hedin/2 seed coat cDNA and vc1 from Mélodie/2 seed coat cDNA. No cDNA was added to the negative controls (%). M, size marker. The experiment was carried out twice with similar results. (f) Selective PCR amplification of vc1 from genomic DNA of four low-vicine cultivars, seven normal-vicine cultivars, a descendant of the original low-vicine line by Duc et al., and two pairs of near-isogenic lines (NPZ1+/NPZ1- and NPZ2+/NPZ2-). The vicine phenotype of each line is color-coded and shown on top of each lane. The experiment was carried out twice with similar results.

