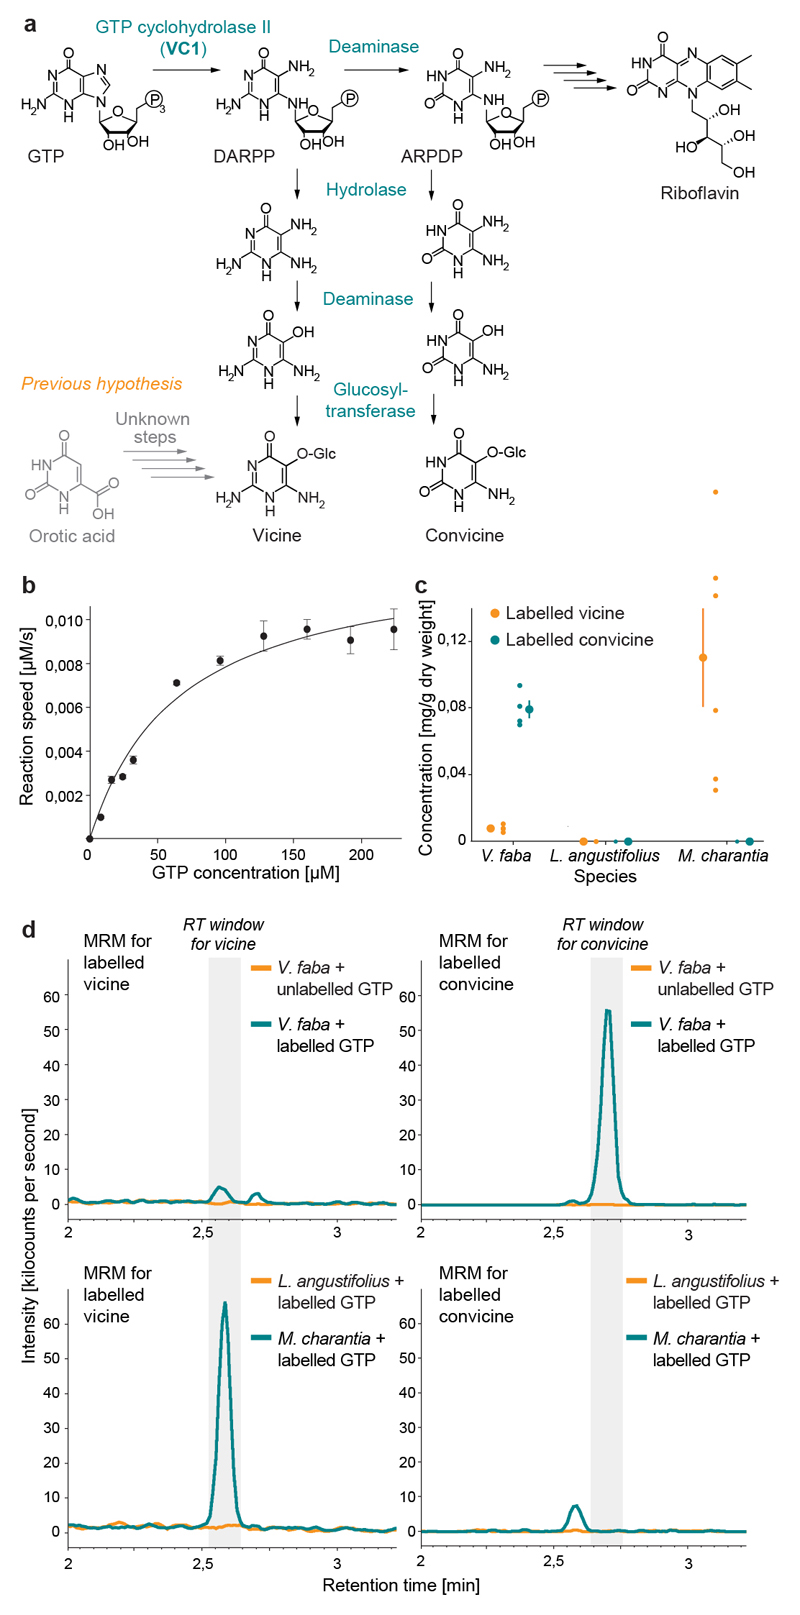
Fig. 4. Characterization of VC1 as a GTP cyclohydrolase II and establishment of GTP as a precursor for vicine and convicine.
(a) Proposed pathway for the biosynthesis of vicine and convicine. (b) Saturation kinetics of the GTP to DARPP conversion catalyzed in vitro by His-tagged VC1. Data points represent the means of 4 replicates; error bars represent standard errors (SEs). The data was fit to a Michaelis-Menten curve with a K M of 66 ± 12 μM (SE) and a V max of 0,013 + 0,001 μM/sec (SE). (c) Conversion of 13C10,15N5-GTP (labeled GTP) into 13C4,15N4-vicine (labeled vicine) and 13C4,15N3-convicine (labeled convicine) by roots of V. faba, L. angustifolius, and M. charantia. Individual data points represent biological replicates, with the number of replicates (n) indicated under each tissue label. For each tissue, the mean ± SEM is presented as the measure of center. (d) Representative chromatograms (multiple reaction monitoring, MRM) showing the elution of labeled vicine (panels on the left) and labeled convicine (panels on the right) from the precursor feeding experiments. The retention time (RT) windows for vicine and convicine are shaded in grey (see Extended Data Fig. 7 for comparison to unlabeled standards). The top two panels correspond to the feeding of faba bean roots with unlabeled and labeled GTP (chromatograms in orange and dark green, respectively). The bottom two panels correspond to the feeding of labeled GTP to roots of Lupinus angustifolius (Fabaceae, non-producer; chromatogram in orange) and Momordica charantia (non-Fabaceae, vicine producer; chromatogram in dark green).

